Most traders chase trends too late or exit too early.
Quant systems don’t predict — they measure and adapt.
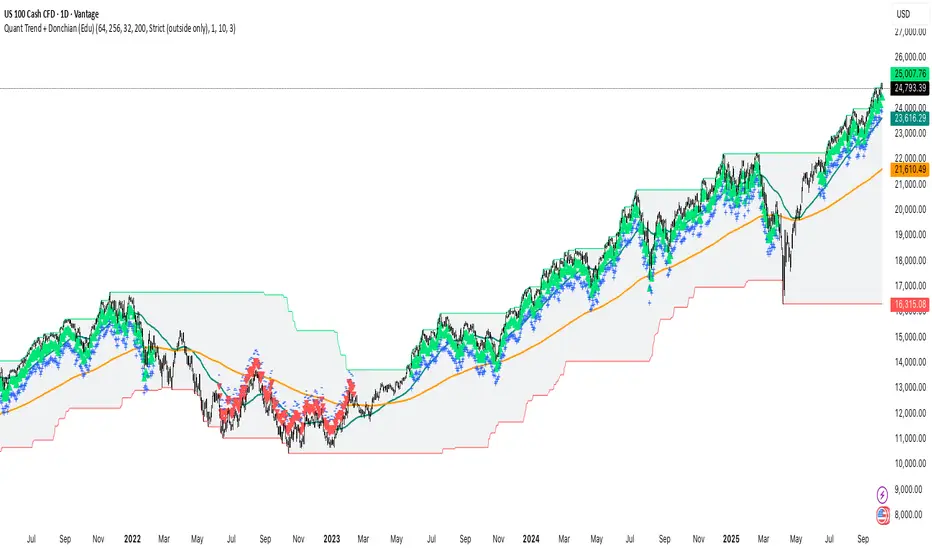
This educational chart uses the public Quant Trend + Donchian indicator to visualize how trend-following and breakout logic can define market regimes in NASDAQ 100 & S&P 500.
⚙️ Core Logic
• Trend — EMA(64 vs 256): approximates EWMAC trend state.
• Breakout — Donchian (200): identifies volatility-based range breaks.
• Volatility awareness — internally normalized to adjust behavior across markets.
📊 How to read it
• EMA fast > EMA slow and price near Donchian high → bullish trend regime.
• EMA fast < EMA slow and price near Donchian low → bearish regime.
• Inside channel with EMAs tangled → range or noise.
💡 Key insight
Regime definition + volatility scaling > entry cleverness.
Systems survive not by prediction, but by risk-controlled persistence.
This public view illustrates the foundations used in my more advanced risk-scaled quant strategies for NASDAQ and S&P indices.
#Quant #TrendFollowing #Breakout #Donchian #EMA #NASDAQ #SP500 #SystematicTrading #AlgorithmicTrading #Volatility
Quant systems don’t predict — they measure and adapt.
This educational chart uses the public Quant Trend + Donchian indicator to visualize how trend-following and breakout logic can define market regimes in NASDAQ 100 & S&P 500.
⚙️ Core Logic
• Trend — EMA(64 vs 256): approximates EWMAC trend state.
• Breakout — Donchian (200): identifies volatility-based range breaks.
• Volatility awareness — internally normalized to adjust behavior across markets.
📊 How to read it
• EMA fast > EMA slow and price near Donchian high → bullish trend regime.
• EMA fast < EMA slow and price near Donchian low → bearish regime.
• Inside channel with EMAs tangled → range or noise.
💡 Key insight
Regime definition + volatility scaling > entry cleverness.
Systems survive not by prediction, but by risk-controlled persistence.
This public view illustrates the foundations used in my more advanced risk-scaled quant strategies for NASDAQ and S&P indices.
#Quant #TrendFollowing #Breakout #Donchian #EMA #NASDAQ #SP500 #SystematicTrading #AlgorithmicTrading #Volatility
📊 Access & Subscription → algorific.gumroad.com/
💬 After purchase, DM @Algorific on TradingView for invite-only access.
💬 After purchase, DM @Algorific on TradingView for invite-only access.
Related publications
Disclaimer
The information and publications are not meant to be, and do not constitute, financial, investment, trading, or other types of advice or recommendations supplied or endorsed by TradingView. Read more in the Terms of Use.