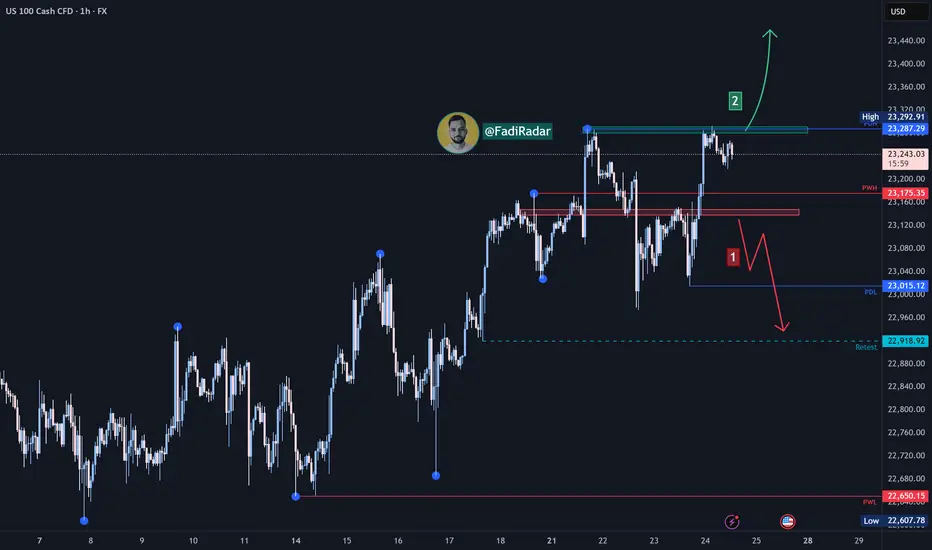
The Nasdaq index continues its upward trend in the medium to long term. Yesterday, it tested the 23,000 USD level and bounced higher toward 23,290 USD.
1️⃣ If the price breaks below 23,100 USD and closes beneath it, we may see a decline toward 23,000 USD, followed by 22,920 USD.
2️⃣ However, if the price holds above 23,290 USD, further bullish momentum could lead to a new high around 23,400 USD.
⚠️ Disclaimer:
This analysis is not financial advice. Please monitor the markets and analyze the data carefully before making any investment decisions.
Disclaimer
The information and publications are not meant to be, and do not constitute, financial, investment, trading, or other types of advice or recommendations supplied or endorsed by TradingView. Read more in the Terms of Use.
Disclaimer
The information and publications are not meant to be, and do not constitute, financial, investment, trading, or other types of advice or recommendations supplied or endorsed by TradingView. Read more in the Terms of Use.