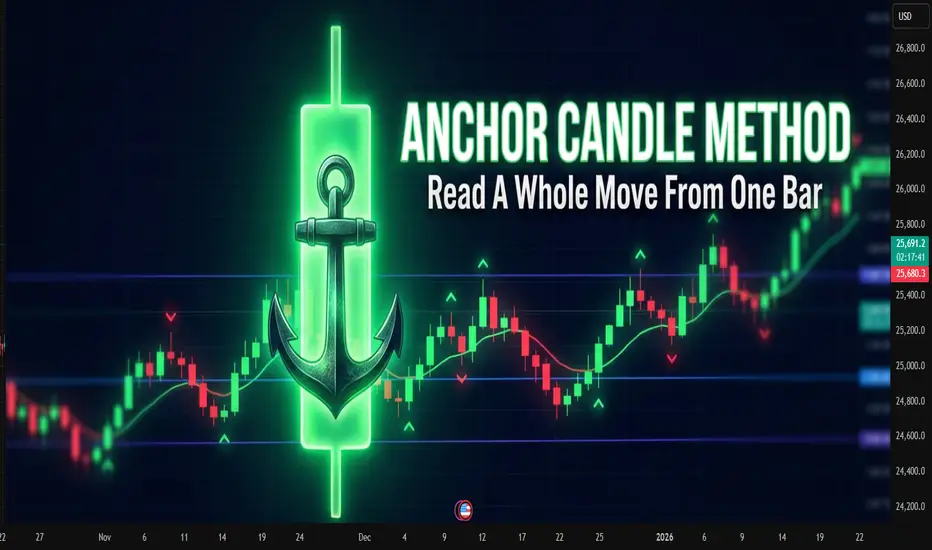
Anchor Candle Method: How To Read A Whole Move From One Bar
Many traders drown in lines, zones, patterns. One simple technique helps simplify the picture: working around a single “anchor candle", the reference candle of the pulse.
The idea is simple: the market often builds further movement around one dominant candle. If you mark up its levels correctly, a ready-made framework appears for reading the trend, pullbacks and false breakouts.
What is an anchor candle
Anchor candle is a wide range candle that starts or refreshes an impulse. It does at least one of these:
Typical traits:
You do not need a perfect definition in points or percent. Anchor candle is mostly a visual tool. The goal is to find the candle around which the rest of the move “organizes” itself.
How to find it on the chart
Step-by-step routine for one instrument and timeframe:
Key levels inside one anchor candle
Once the candle is chosen, mark four levels:
Each level has a function.
Midline (50%)
Midline splits “control”. For a bullish anchor:
Close
Close shows which side won the battle inside that bar. If later price keeps reacting near that close, it confirms that the market “remembers” this candle.
Basic trading scenarios around a bullish anchor
Assume an uptrend and a bullish anchor candle.
1. Trend continuation from the upper half
Pattern:
Idea: buyers defend control above 50%. Entries often come:
Stops usually go under the low of the anchor or under the last local swing inside it, depending on risk tolerance.
2. Failed breakout and reversal from the high
Pattern:
This often reveals exhausted buyers. For counter-trend or early reversal trades, traders:
3. Full loss of control below the low
When price not only enters the lower half, but closes below the low and stays there, the market sends a clear message: the impulse is broken.
Traders use this in two ways:
Bearish anchor: same logic upside-down
For a bearish anchor candle in a downtrend:
The structure is mirrored, the reading logic stays the same.
Practical routine you can repeat every day
A compact checklist many traders follow:
This method does not remove uncertainty. It just compresses market noise into a small set of reference points.
Common mistakes with anchor candles
Anchor candles age. Fresh impulses usually provide better structure than old ones.
Many traders drown in lines, zones, patterns. One simple technique helps simplify the picture: working around a single “anchor candle", the reference candle of the pulse.
The idea is simple: the market often builds further movement around one dominant candle. If you mark up its levels correctly, a ready-made framework appears for reading the trend, pullbacks and false breakouts.
What is an anchor candle
Anchor candle is a wide range candle that starts or refreshes an impulse. It does at least one of these:
- Breaks an important high or low
- Starts a strong move after a tight range
- Flips local structure from “choppy” to “trending”
Typical traits:
- Range clearly larger than nearby candles
- Close near one edge of the range (top in an up impulse, bottom in a down impulse)
- Comes after compression, range or slow grind
You do not need a perfect definition in points or percent. Anchor candle is mostly a visual tool. The goal is to find the candle around which the rest of the move “organizes” itself.
How to find it on the chart
Step-by-step routine for one instrument and timeframe:
- Mark the current short-term trend on higher timeframe (for example 1H if you trade 5–15M).
- Drop to the working timeframe.
- Find the last strong impulse in the direction of that trend.
- Inside this impulse look for the widest candle that clearly stands out.
- Check that it did something “important”: broke a range, cleared a local high/low, or started the leg.
If nothing stands out, skip. The method works best on clean impulses, not on flat, overlapping price.
Key levels inside one anchor candle
Once the candle is chosen, mark four levels:
- High of the candle
- Low of the candle
- 50% of the range (midline)
- Close of the candle
Each level has a function.
High
For a bullish anchor, the high acts like a “ceiling” where late buyers often get trapped. When price trades above and then falls back inside, it often marks a failed breakout or liquidity grab.
Low
For a bullish anchor, the low works as structural invalidation. Deep close under the low tells that the original impulse was absorbed.
Midline (50%)
Midline splits “control”. For a bullish anchor:
- Holding above 50% keeps control with buyers
- Consistent closes below 50% shows that sellers start to dominate inside the same candle
Close
Close shows which side won the battle inside that bar. If later price keeps reacting near that close, it confirms that the market “remembers” this candle.
Basic trading scenarios around a bullish anchor
Assume an uptrend and a bullish anchor candle.
1. Trend continuation from the upper half
Pattern:
- After the anchor candle, price pulls back into its upper half
- Pullback holds above the midline
- Volume or volatility dries up on the pullback, then fresh buying appears
Idea: buyers defend control above 50%. Entries often come:
- On rejection from the midline
- On break of a small local high inside the upper half
Stops usually go under the low of the anchor or under the last local swing inside it, depending on risk tolerance.
2. Failed breakout and reversal from the high
Pattern:
- Price trades above the high of the anchor
- Quickly falls back inside the range
- Subsequent candles close inside or below the midline
This often reveals exhausted buyers. For counter-trend or early reversal trades, traders:
- Wait for a clear close back inside the candle
- Use the high of the anchor as invalidation for short setups
3. Full loss of control below the low
When price not only enters the lower half, but closes below the low and stays there, the market sends a clear message: the impulse is broken.
Traders use this in two ways:
- Exit remaining longs that depended on this impulse
- Start to plan shorts on retests of the low from below, now as resistance
Bearish anchor: same logic upside-down
For a bearish anchor candle in a downtrend:
- Low becomes “trap” level for late sellers
- High becomes invalidation
- Upper half of the candle is “shorting zone”
- Close and midline still help to judge who controls the bar
The structure is mirrored, the reading logic stays the same.
Practical routine you can repeat every day
A compact checklist many traders follow:
- Define higher-timeframe bias
- On working timeframe, find the latest clear impulse in that direction
- Pick the anchor candle that represents this impulse
- Mark high, low, midline, close
- Note where price trades relative to these levels
- Decide: trend continuation, failed breakout, or broken structure
This method does not remove uncertainty. It just compresses market noise into a small set of reference points.
Common mistakes with anchor candles
- Choosing every bigger-than-average candle as anchor, even inside messy ranges
- Ignoring higher timeframe bias and trading every signal both ways
- Forcing trades on each touch of an anchor level without context
- Keeping the same anchor for days when the market already formed a new impulse
Anchor candles age. Fresh impulses usually provide better structure than old ones.
A note about indicators
Many traders prefer to mark such candles and levels by hand, others rely on indicators that highlight wide range bars and draw levels automatically. Manual reading trains the eye, while automated tools often save time when many charts and timeframes are under review at once.
If you enjoyed my view on the market and chart analysis, make sure to subscribe so you don’t miss new trading ideas 🙌
I trade using the Midas indicator – if you’d like to test it, send me a message.
t.me/midas_ind
discord.gg/XcYnFcwM
I trade using the Midas indicator – if you’d like to test it, send me a message.
t.me/midas_ind
discord.gg/XcYnFcwM
Disclaimer
The information and publications are not meant to be, and do not constitute, financial, investment, trading, or other types of advice or recommendations supplied or endorsed by TradingView. Read more in the Terms of Use.