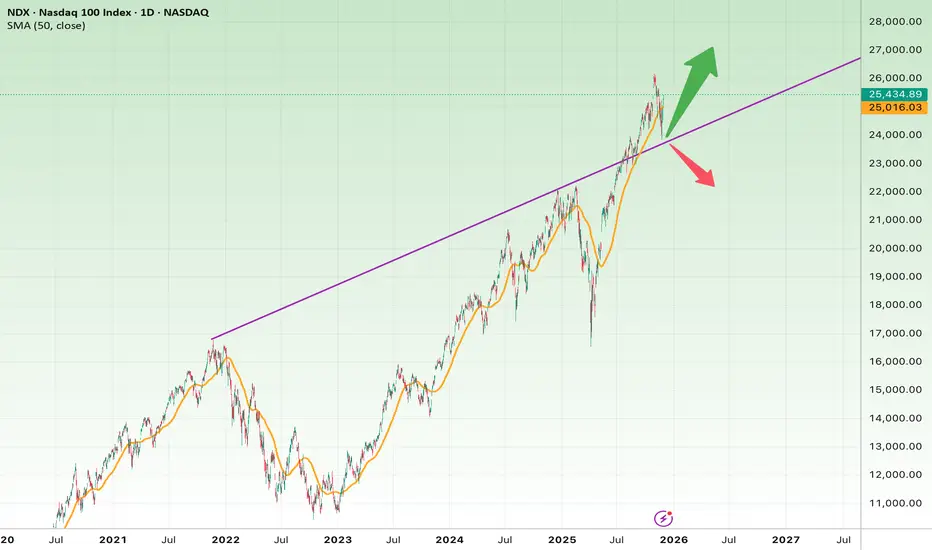
The chart shows that the Nasdaq 100 has been in a strong multi-year uptrend from 2023 to 2025 and is now touching a major long-term ascending trendline (purple line).
This is one of the most critical decision zones for the index.
Bullish Scenario (More Likely at the Moment)
Price is currently holding above the long-term trendline and is also trading above the SMA50 (orange line), which still has a positive upward slope.
If the price continues to respect this trendline:
Bullish Targets
• 26,600
• 27,200
• 28,000 (major upside target)
Signals that strengthen the bullish case:
• A breakout above the previous high near 25,900–26,000
• Strong closing candles above the trendline
• Increasing bullish volume
Bearish Scenario (If the Trendline Breaks)
If the index breaks below the ascending trendline and then loses the SMA50, it could enter a broader corrective phase.
Bearish Targets
• 23,800 – first major support
• 22,500
• 20,800 – key structural support
Bearish confirmation signs:
• A strong breakdown candle below the trendline
• Failure to reclaim the SMA50
• Weak or failed retest (pullback) of the broken trendline
Logical Stop-Loss Zones
• Long positions: Below 24,600
• Short positions: Above 25,900
Quick Summary
• NDX is sitting right on a major long-term trendline.
• Bullish scenario remains stronger as long as the trendline holds.
• Breaking the trendline would likely trigger a deeper correction.
• Holding above it could push price toward 27K–28K.
Disclaimer
The information and publications are not meant to be, and do not constitute, financial, investment, trading, or other types of advice or recommendations supplied or endorsed by TradingView. Read more in the Terms of Use.
Disclaimer
The information and publications are not meant to be, and do not constitute, financial, investment, trading, or other types of advice or recommendations supplied or endorsed by TradingView. Read more in the Terms of Use.