Eyes on $1,267 Breakout 🚀
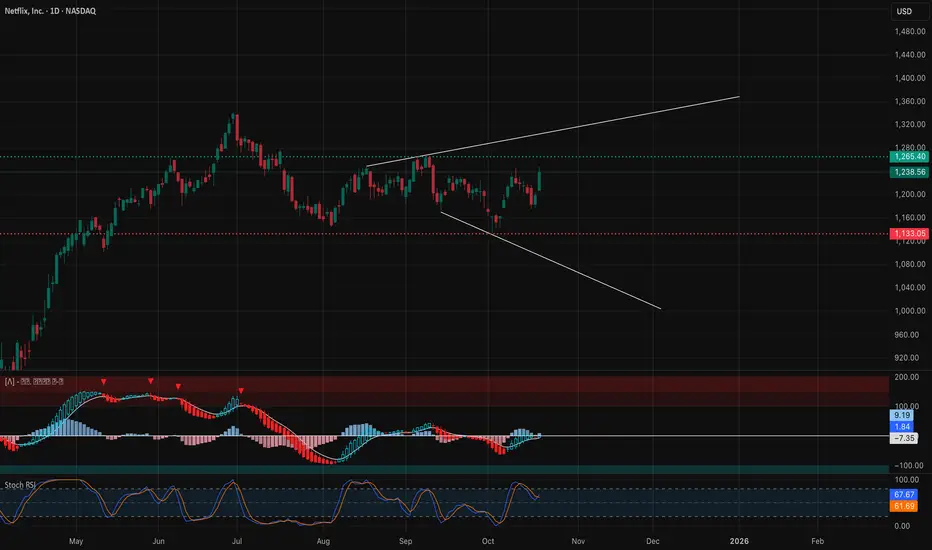
📆 Daily Chart — Macro Trend and Structure Overview
Market Structure: Netflix (NFLX) printed a powerful rebound candle off the $1,134–$1,160 demand zone, signaling renewed buying interest. This level has acted as a structural support in multiple swing cycles. The daily chart shows a recent BOS (Break of Structure) after a series of CHoCH formations, suggesting that smart money may be repositioning long after liquidity was swept below October lows.
The move from $1,134 to $1,238 marks the first aggressive bullish displacement in weeks, shifting momentum back toward the mid-trend channel.
Supply & Demand / Order Blocks:
* Demand Zone: $1,134–$1,160 (major re-accumulation zone).
* Intermediate Supply Zone: $1,238–$1,267 (previous CHoCH and liquidity pocket).
* Macro Supply Zone: $1,310–$1,330 (upper liquidity target).
Indicator Confluence:
* 9 EMA > 21 EMA: Cross underway — bullish realignment possible by Tuesday.
* MACD: Momentum reversal confirmed with a fresh histogram cross above zero.
* Stoch RSI: Rising from 20 → 67 — strong mid-cycle momentum.
* Volume: Bullish expansion day, matching the most recent BOS in September.
The daily chart suggests that the $1,134 base is secure, and price may now aim to retest $1,267 before consolidating again.
⏱️ 1-Hour Chart — Short-Term Swing Setup

Market Structure: The 1-hour chart shows clear transition from bearish to bullish structure with a CHoCH → BOS sequence near $1,200 and $1,240. Price broke out of the descending channel and is consolidating right below resistance at $1,245–$1,247, the zone of the most recent BOS.
Momentum remains strong, and any pullback toward $1,217–$1,225 should offer dip-buying opportunities if volume holds.
Supply & Demand / OB Zones:
* Demand Zone: $1,217–$1,225 (recent breakout OB).
* Supply Zone: $1,244–$1,267 (major liquidity resistance).
Indicator Confluence:
* 9 EMA > 21 EMA: Bullish continuation structure.
* MACD: Rising histogram — bullish volume expansion.
* Stoch RSI: Above 70, showing continuation with mild overbought stretch.
Trade Scenarios:
* Bullish Setup: Buy dips near $1,217 → Target $1,267 → Stop below $1,199.
* Bearish Setup: Rejection from $1,267 → Short to $1,217 → Stop above $1,280.
Bias favors upside while price holds above $1,217 — breaking $1,267 could trigger momentum extension toward $1,300.
🕒 15-Minute Chart — Intraday Scalping View

Market Structure: The 15-min timeframe shows a clean ascending channel, with multiple BOS confirming short-term trend strength. The most recent CHoCH near $1,237 was defended quickly, proving that intraday buyers are actively holding higher lows.
The pattern shows minor compression under resistance, suggesting either a small consolidation before a push to $1,260+ or a quick retest of $1,230 support.
Supply & Demand / OB Levels:
* Demand Zone: $1,235–$1,238 (minor OB base).
* Supply Zone: $1,247–$1,255 (scalp resistance range).
Indicator Confluence:
* 9 EMA & 21 EMA: Strong uptrend alignment.
* MACD: Momentum fading slightly — potential micro pullback.
* Stoch RSI: Overbought (80+) — short-term pause likely.
Scalp Plan:
* Bullish Case: Buy retest at $1,235–$1,238 → Target $1,247 → Stop $1,230.
* Bearish Case: Fade $1,247–$1,250 → Target $1,235 → Stop $1,255.
Intraday trend remains bullish — buyers in control while above $1,230. Expect a range break toward $1,255–$1,267 if volume persists.
📊 GEX (Gamma Exposure) & Options Sentiment

NFLX’s GEX structure indicates a bullish gamma expansion zone between $1,220–$1,260. Dealer exposure favors stability near $1,240, creating a “magnet” effect that can accelerate upward once $1,247 breaks.
Key GEX Levels:
* Highest Positive GEX: $1,260 (major call resistance).
* 2nd Call Wall: $1,280 (extension target).
* Put Support: $1,160 (floor of dealer hedging zone).
* IVR: 37 — moderate, rising ahead of next catalyst.
* Call Flow: 29.1% — improving, consistent with accumulation behavior.
Dealers are currently neutral-to-positive gamma, supporting controlled bullish drift. Above $1,260, expect increased dealer hedging pressure to lift price further.
🎯 Closing Outlook
Netflix is showing strong signs of accumulation and breakout potential following a clean structure shift on both the daily and hourly timeframes. Volume confirmation and positive gamma support add confidence to the bullish scenario.
A sustained close above $1,247–$1,267 could trigger a measured move toward $1,300–$1,310. If rejected, a controlled pullback to $1,217–$1,225 remains a healthy buy zone for continuation.
Disclaimer: This analysis is for educational purposes only and does not constitute financial advice. Always perform your own due diligence before trading.
📆 Daily Chart — Macro Trend and Structure Overview
Market Structure: Netflix (NFLX) printed a powerful rebound candle off the $1,134–$1,160 demand zone, signaling renewed buying interest. This level has acted as a structural support in multiple swing cycles. The daily chart shows a recent BOS (Break of Structure) after a series of CHoCH formations, suggesting that smart money may be repositioning long after liquidity was swept below October lows.
The move from $1,134 to $1,238 marks the first aggressive bullish displacement in weeks, shifting momentum back toward the mid-trend channel.
Supply & Demand / Order Blocks:
* Demand Zone: $1,134–$1,160 (major re-accumulation zone).
* Intermediate Supply Zone: $1,238–$1,267 (previous CHoCH and liquidity pocket).
* Macro Supply Zone: $1,310–$1,330 (upper liquidity target).
Indicator Confluence:
* 9 EMA > 21 EMA: Cross underway — bullish realignment possible by Tuesday.
* MACD: Momentum reversal confirmed with a fresh histogram cross above zero.
* Stoch RSI: Rising from 20 → 67 — strong mid-cycle momentum.
* Volume: Bullish expansion day, matching the most recent BOS in September.
The daily chart suggests that the $1,134 base is secure, and price may now aim to retest $1,267 before consolidating again.
⏱️ 1-Hour Chart — Short-Term Swing Setup
Market Structure: The 1-hour chart shows clear transition from bearish to bullish structure with a CHoCH → BOS sequence near $1,200 and $1,240. Price broke out of the descending channel and is consolidating right below resistance at $1,245–$1,247, the zone of the most recent BOS.
Momentum remains strong, and any pullback toward $1,217–$1,225 should offer dip-buying opportunities if volume holds.
Supply & Demand / OB Zones:
* Demand Zone: $1,217–$1,225 (recent breakout OB).
* Supply Zone: $1,244–$1,267 (major liquidity resistance).
Indicator Confluence:
* 9 EMA > 21 EMA: Bullish continuation structure.
* MACD: Rising histogram — bullish volume expansion.
* Stoch RSI: Above 70, showing continuation with mild overbought stretch.
Trade Scenarios:
* Bullish Setup: Buy dips near $1,217 → Target $1,267 → Stop below $1,199.
* Bearish Setup: Rejection from $1,267 → Short to $1,217 → Stop above $1,280.
Bias favors upside while price holds above $1,217 — breaking $1,267 could trigger momentum extension toward $1,300.
🕒 15-Minute Chart — Intraday Scalping View
Market Structure: The 15-min timeframe shows a clean ascending channel, with multiple BOS confirming short-term trend strength. The most recent CHoCH near $1,237 was defended quickly, proving that intraday buyers are actively holding higher lows.
The pattern shows minor compression under resistance, suggesting either a small consolidation before a push to $1,260+ or a quick retest of $1,230 support.
Supply & Demand / OB Levels:
* Demand Zone: $1,235–$1,238 (minor OB base).
* Supply Zone: $1,247–$1,255 (scalp resistance range).
Indicator Confluence:
* 9 EMA & 21 EMA: Strong uptrend alignment.
* MACD: Momentum fading slightly — potential micro pullback.
* Stoch RSI: Overbought (80+) — short-term pause likely.
Scalp Plan:
* Bullish Case: Buy retest at $1,235–$1,238 → Target $1,247 → Stop $1,230.
* Bearish Case: Fade $1,247–$1,250 → Target $1,235 → Stop $1,255.
Intraday trend remains bullish — buyers in control while above $1,230. Expect a range break toward $1,255–$1,267 if volume persists.
📊 GEX (Gamma Exposure) & Options Sentiment
NFLX’s GEX structure indicates a bullish gamma expansion zone between $1,220–$1,260. Dealer exposure favors stability near $1,240, creating a “magnet” effect that can accelerate upward once $1,247 breaks.
Key GEX Levels:
* Highest Positive GEX: $1,260 (major call resistance).
* 2nd Call Wall: $1,280 (extension target).
* Put Support: $1,160 (floor of dealer hedging zone).
* IVR: 37 — moderate, rising ahead of next catalyst.
* Call Flow: 29.1% — improving, consistent with accumulation behavior.
Dealers are currently neutral-to-positive gamma, supporting controlled bullish drift. Above $1,260, expect increased dealer hedging pressure to lift price further.
🎯 Closing Outlook
Netflix is showing strong signs of accumulation and breakout potential following a clean structure shift on both the daily and hourly timeframes. Volume confirmation and positive gamma support add confidence to the bullish scenario.
A sustained close above $1,247–$1,267 could trigger a measured move toward $1,300–$1,310. If rejected, a controlled pullback to $1,217–$1,225 remains a healthy buy zone for continuation.
Disclaimer: This analysis is for educational purposes only and does not constitute financial advice. Always perform your own due diligence before trading.
Disclaimer
The information and publications are not meant to be, and do not constitute, financial, investment, trading, or other types of advice or recommendations supplied or endorsed by TradingView. Read more in the Terms of Use.
Disclaimer
The information and publications are not meant to be, and do not constitute, financial, investment, trading, or other types of advice or recommendations supplied or endorsed by TradingView. Read more in the Terms of Use.