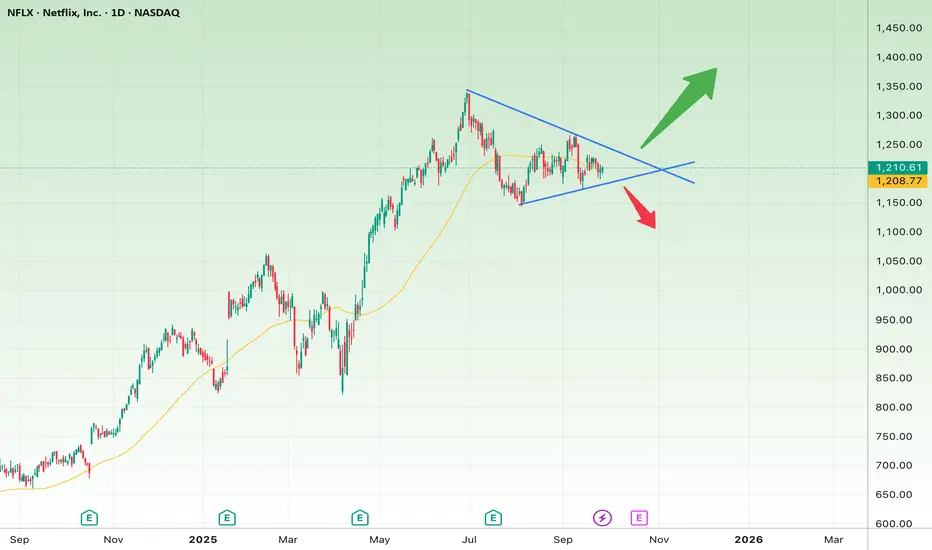
The Netflix (NFLX) daily chart is showing a symmetrical triangle pattern. This usually forms before a strong breakout, and right now price is sitting at a decision point.
🔎 Short-Term Outlook (1–3 weeks)
Pattern: Symmetrical triangle around $1,200
Bullish Scenario:
A breakout above the upper trendline ($1,230–$1,240) could trigger strong buying momentum.
Targets:
First target: $1,300
Second target: $1,350
Stop-loss: Below $1,180
Bearish Scenario:
A breakdown below the lower trendline ($1,190) may lead to increased selling pressure.
Targets:
First target: $1,120
Second target: $1,050
Stop-loss: Above $1,240
🔎 Long-Term Outlook (2–6 months)
The overall trend since late 2024 has been bullish, with the 50-day moving average still supporting price action.
Bullish Scenario:
A confirmed breakout and consolidation above $1,240 could pave the way toward:
First target: $1,400
Second target (long-term): $1,500
Bearish Scenario:
If the triangle breaks downward and price holds below $1,150, the medium-term bullish structure could collapse.
Targets:
$1,050
$950 (key long-term support)
Stop-loss (long-term): Below $1,150
📌 Summary:
In the short term, the $1,190–$1,240 range is the key decision zone.
In the long term, the bias remains bullish unless price loses $1,150.
Disclaimer
The information and publications are not meant to be, and do not constitute, financial, investment, trading, or other types of advice or recommendations supplied or endorsed by TradingView. Read more in the Terms of Use.
Disclaimer
The information and publications are not meant to be, and do not constitute, financial, investment, trading, or other types of advice or recommendations supplied or endorsed by TradingView. Read more in the Terms of Use.