Marker Overview:
The NIFTY is exhibiting signs of consolidation after a significant uptrend.But the formation of a Doji candlestick pattern on the Daily TF Chart suggests a state of equilibrium and indecision between bulls and bears. A breakout or breakdown from the current tight range will likely dictate the next directional move.
Intraday Trend (Based on the 15-minute chart)
Trend: Sideways / Mildly bearish. The price action shows the index struggling to sustain above the 25,234 level. The Lower HIGH Lower LOW on Daily Chart and the close near the day's low indicates selling pressure at higher levels.
Short-term (1–3 days): Mildly bearish, needs strength above 25,234
Trend: Losing Momentum. The broader short-term trend from the recent Lows is still up. However, the formation of a Doji candle right at the highs is a warning sign of potential exhaustion.
Summary:
NIFTY is at a critical juncture. The medium-term outlook is bullish, but the short-term price action shows indecision. The Doji candlestick at the peak suggests the rally may be pausing.
Bullish Scenario: A sustained move above 25,214-25235 zone with volume could lead to a continuation of the uptrend towards 25,335- 25360 and higher.
Bearish Scenario: A break below 25,074 could trigger a short-term correction towards the 25,000 Psychological support level. A break below 24,900 would be a more significant bearish signal & may Test 24845 Level..
Traders should watch for a decisive breakout above resistance or a breakdown below support for the next clear directional cue. Watch 25,135 & 25,070 for support, and 25,234 & 25,299 for upside confirmation.
If NIFTY holds above 25,135, bulls may attempt a bounce. Below 25,070, weakness accelerates.
Key Support Levels (Rather than Calculated Plotted Levels)
25,135 – 25,154 (near-term support)
25,074 (critical support)
25,000 – 24,975 (major support zone, if broken trend may weaken)
Key Resistance Levels (Rather than Calculated Plotted Levels)
25,215 – 25,234 (immediate hurdle)
25,303 – 25,334 (short-term supply zone)
25,367 – 25,393 (major upside resistance)
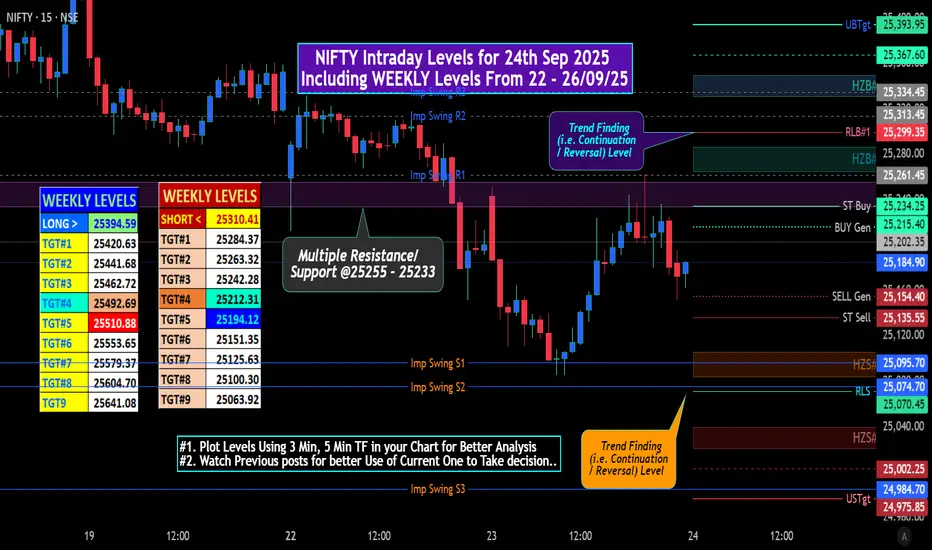
# "WEEKLY Levels" mentioned in BOX format.
^^^^^^^Plot Levels Using 3 Min, 5 Min Time frame in your Chart for Better Analysis^^^^^^^
L#1: If the candle crossed & stays above the “Buy Gen”, it is treated / considered as Bullish bias.
L#2: Possibility / Probability of REVERSAL near RLB#1 & UBTgt
L#3: If the candle stays above “Sell Gen” but below “Buy Gen”, it is treated / considered as Sidewise. Aggressive Traders can take Long position near “Sell Gen” either retesting or crossed from Below & vice-versa i.e. can take Short position near “Buy Gen” either retesting or crossed downward from Above.
L#4: If the candle crossed & stays below the “Sell Gen”, it is treated / considered a Bearish bias.
L#5: Possibility / Probability of REVERSAL near RLS#1 & USTgt
HZB (Buy side) & HZS (Sell side) => Hurdle Zone,
*** Specialty of “HZB#1, HZB#2 HZS#1 & HZS#2” is Sidewise (behaviour in Nature)
Rest Plotted and Mentioned on Chart
Color code Used:
Green =. Positive bias.
Red =. Negative bias.
RED in Between Green means Trend Finder / Momentum Change
/ CYCLE Change and Vice Versa.
Notice One thing: HOW LEVELS are Working.
Use any Momentum Indicator / Oscillatoror as you "USED to" to Take entry.
📢 Disclaimer
I am not a SEBI-registered financial adviser.
The information, views, and ideas shared here are purely for educational and informational purposes only. They are not intended as investment advice or a recommendation to buy, sell, or hold any financial instruments.
Trading and investing in the stock market involves risk, and you should do your own research and analysis. You are solely responsible for any decisions made based on this research.
"As HARD EARNED MONEY IS YOUR's, So DECISION SHOULD HAVE TO BE YOUR's".
The NIFTY is exhibiting signs of consolidation after a significant uptrend.But the formation of a Doji candlestick pattern on the Daily TF Chart suggests a state of equilibrium and indecision between bulls and bears. A breakout or breakdown from the current tight range will likely dictate the next directional move.
Intraday Trend (Based on the 15-minute chart)
Trend: Sideways / Mildly bearish. The price action shows the index struggling to sustain above the 25,234 level. The Lower HIGH Lower LOW on Daily Chart and the close near the day's low indicates selling pressure at higher levels.
Short-term (1–3 days): Mildly bearish, needs strength above 25,234
Trend: Losing Momentum. The broader short-term trend from the recent Lows is still up. However, the formation of a Doji candle right at the highs is a warning sign of potential exhaustion.
Summary:
NIFTY is at a critical juncture. The medium-term outlook is bullish, but the short-term price action shows indecision. The Doji candlestick at the peak suggests the rally may be pausing.
Bullish Scenario: A sustained move above 25,214-25235 zone with volume could lead to a continuation of the uptrend towards 25,335- 25360 and higher.
Bearish Scenario: A break below 25,074 could trigger a short-term correction towards the 25,000 Psychological support level. A break below 24,900 would be a more significant bearish signal & may Test 24845 Level..
Traders should watch for a decisive breakout above resistance or a breakdown below support for the next clear directional cue. Watch 25,135 & 25,070 for support, and 25,234 & 25,299 for upside confirmation.
If NIFTY holds above 25,135, bulls may attempt a bounce. Below 25,070, weakness accelerates.
Key Support Levels (Rather than Calculated Plotted Levels)
25,135 – 25,154 (near-term support)
25,074 (critical support)
25,000 – 24,975 (major support zone, if broken trend may weaken)
Key Resistance Levels (Rather than Calculated Plotted Levels)
25,215 – 25,234 (immediate hurdle)
25,303 – 25,334 (short-term supply zone)
25,367 – 25,393 (major upside resistance)
# "WEEKLY Levels" mentioned in BOX format.
^^^^^^^Plot Levels Using 3 Min, 5 Min Time frame in your Chart for Better Analysis^^^^^^^
L#1: If the candle crossed & stays above the “Buy Gen”, it is treated / considered as Bullish bias.
L#2: Possibility / Probability of REVERSAL near RLB#1 & UBTgt
L#3: If the candle stays above “Sell Gen” but below “Buy Gen”, it is treated / considered as Sidewise. Aggressive Traders can take Long position near “Sell Gen” either retesting or crossed from Below & vice-versa i.e. can take Short position near “Buy Gen” either retesting or crossed downward from Above.
L#4: If the candle crossed & stays below the “Sell Gen”, it is treated / considered a Bearish bias.
L#5: Possibility / Probability of REVERSAL near RLS#1 & USTgt
HZB (Buy side) & HZS (Sell side) => Hurdle Zone,
*** Specialty of “HZB#1, HZB#2 HZS#1 & HZS#2” is Sidewise (behaviour in Nature)
Rest Plotted and Mentioned on Chart
Color code Used:
Green =. Positive bias.
Red =. Negative bias.
RED in Between Green means Trend Finder / Momentum Change
/ CYCLE Change and Vice Versa.
Notice One thing: HOW LEVELS are Working.
Use any Momentum Indicator / Oscillatoror as you "USED to" to Take entry.
📢 Disclaimer
I am not a SEBI-registered financial adviser.
The information, views, and ideas shared here are purely for educational and informational purposes only. They are not intended as investment advice or a recommendation to buy, sell, or hold any financial instruments.
Trading and investing in the stock market involves risk, and you should do your own research and analysis. You are solely responsible for any decisions made based on this research.
"As HARD EARNED MONEY IS YOUR's, So DECISION SHOULD HAVE TO BE YOUR's".
Related publications
Disclaimer
The information and publications are not meant to be, and do not constitute, financial, investment, trading, or other types of advice or recommendations supplied or endorsed by TradingView. Read more in the Terms of Use.
Related publications
Disclaimer
The information and publications are not meant to be, and do not constitute, financial, investment, trading, or other types of advice or recommendations supplied or endorsed by TradingView. Read more in the Terms of Use.