Nifty Intraday for 22 April We saw a V-shaped recovery in Friday's trading session, but it came after a considerable downfall throughout the week, so it was hard to trust this recovery. It might be a dead cat bounce or a trap; however, as intraday traders, we must engage in trading regardless of the market's behaviour. Only r
About Nifty 50 Index
NIFTY 50 is the main index for the National Stock Exchange of India (NSE). It tracks the performance of the top 50 stocks by market capitalization from 13 sectors of the Indian economy. With such a relatively small number of companies within the index it still represents over 60% of the free float market capitalization of the stocks listed on NSE, and serves as a benchmark for fund portfolios and index funds. The list of the NIFTY 50 Index constituents is rescheduled every 6 month.

TRADING LEVELS FOR NIFTY 22-04-2024// use 5mtf
// i give pairs of lines colored red and blue . if you have any more conformations you can take tardes form that areas

NIFTY TRADING LEVELS ONLY FOR 24-04-2024//- use 5m time frame
// -i give pairs of lines colored red and blue . if you have any more conformations you can take tardes form that areas

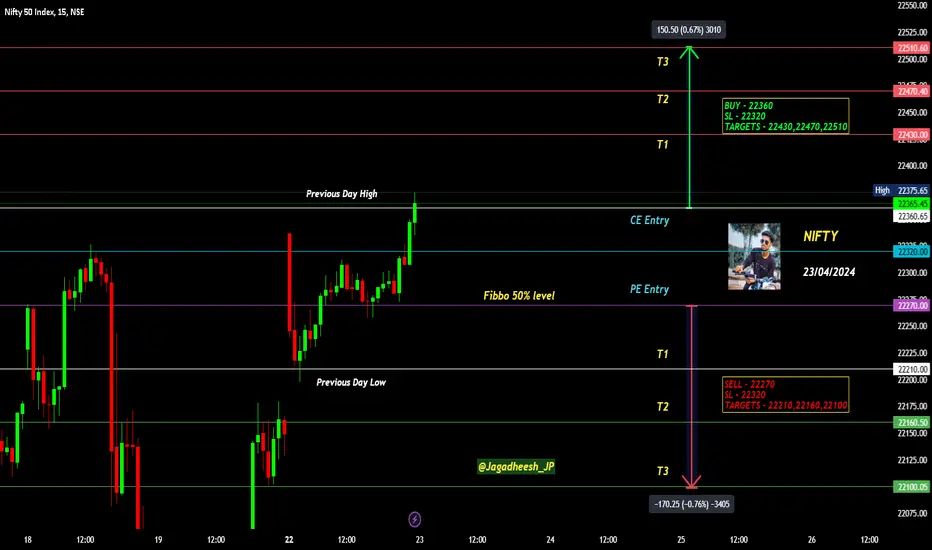
NIFTY TRADING LEVELS ONLY FOR 23-04-2024// use 5mtf
// i give pairs of lines colored red and blue . if you have any more conformations you can take tardes form that areas

NIFTY DAILY - 25/4/2024Nifty opens gap down but bulls stretch their arms for yet another session and made days high that is 22625.
Nifty was up almost 200+ points, at closing time nifty was up by 167 points which is 0.75%.
Index has formed a big green body candle with upper shadow on daily chart which indicates partic

NIFTY INTRADAY LEVELS FOR 25/04/2024BUY ABOVE - 22430
SL - 22360
TARGETS - 22470,22510,22570
SELL BELOW - 22360
SL - 22430
TARGETS - 22320,22270,22210
NO TRADE ZONE - 22360 to 22430
Previous Day High - 22470
Previous Day Low - 22390
Based on price action major support & resistance's are here, the red lines acts as resistances, t

trading levels for nifty 19-04-2024// use 5mtf
// i give 6 pairs of lines colored red and blue . if you have any more conformations you can take tardes form that areas

NIFTY TRADING LEVELS ONLY FOR 26-04-2024Explanation:
This is a very useful trading system. This means that you should not take a trade blindly, but rather that there is another confirmation to take the trade you can use this for perfect entry and perfect exit
This trading opportunity is based on volume, previous price, and price range

NIFTY INTRADAY LEVELS FOR 22/04/2024BUY ABOVE - 22160
SL - 22100
TARGETS - 22210,22270,22320
SELL BELOW - 22100
SL - 22160
TARGETS - 22050,22000,21960
NO TRADE ZONE - 22100 to 22160
Previous Day High - 22160
Previous Day Low - 21800
Based on price action major support & resistance's are here, the red lines acts as resistances, t

NIFTY INTRADAY LEVELS FOR 23/04/2024BUY ABOVE - 22360
SL - 22320
TARGETS - 22430,22470,22510
SELL BELOW - 22270
SL - 22320
TARGETS - 22210,22160,22100
NO TRADE ZONE - 22270 to 22360
Previous Day High - 22360
Previous Day Low - 22210
Based on price action major support & resistance's are here, the red lines acts as resistances, t
See all ideas
Frequently Asked Questions
The Nifty 50 Index is comprised of 50 instruments including NSE:RELIANCE, NSE:TCS, NSE:HDFCBANK and others. See the full list of Nifty 50 Index components to find more opportunities.
The highest-priced instruments on Nifty 50 Index are NSE:MARUTI, NSE:ULTRACEMCO, and NSE:BAJAJ_AUTO - they'll cost you 12703.35 INR, 9700.90 INR, and 8974.30 INR accordingly.
The champion of Nifty 50 Index is NSE:NTPC - it's gained 109.41% over the year.
The weakest component of Nifty 50 Index is NSE:KOTAKBANK - it's lost 14.30% over the year.
The top companies of Nifty 50 Index are NSE:RELIANCE, NSE:TCS, and NSE:HDFCBANK - they can boast market cap of 236.84 B INR, 167.17 B INR, and 137.66 B INR accordingly.
The current value of Nifty 50 Index is 22419.95 INR — it has fallen by 0.67% in the past 24 hours.
Nifty 50 Index value has increased by 2.55% in the past week, since last month it has shown a 1.66% increase, and over the year it's increased by 25.86%.
Nifty 50 Index is just a number that lets you track performance of the instruments comprising the index, so you can't invest in it directly. But you can buy Nifty 50 Index futures or funds or invest in its components.
The lowest ever quote of Nifty 50 Index is 279.00 INR. It was reached on Jul 3, 1990.
Nifty 50 Index reached its highest quote on Apr 10, 2024 — 22775.70 INR.