🚀 "WEEKLY Levels" mentioned in BOX format.
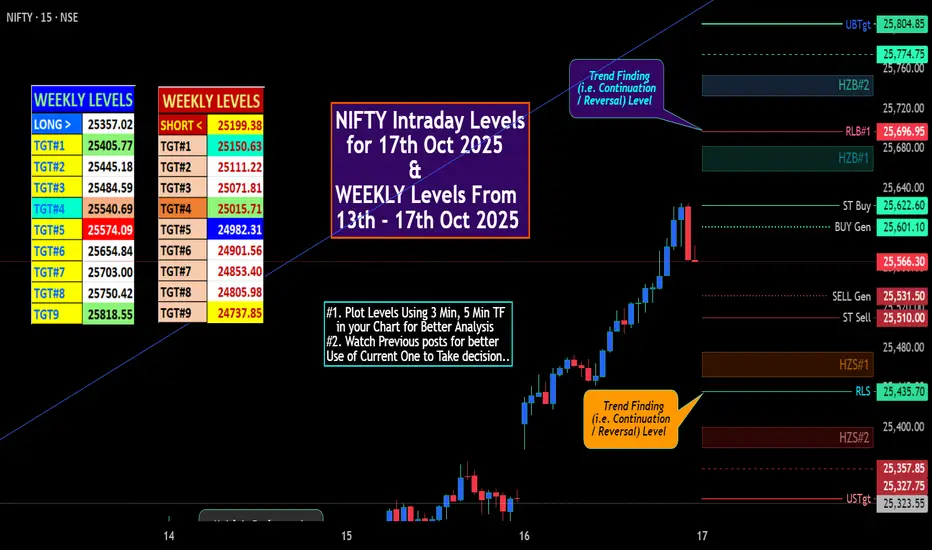
🌡️Plot Levels Using 3 Min, 5 Min Time frame in your Chart for Better Analysis
L#1: If the candle crossed & stays above the “Buy Gen”, it is treated / considered as Bullish bias.
L#2: Possibility / Probability of REVERSAL near RLB#1 & UBTgt
L#3: If the candle stays above “Sell Gen” but below “Buy Gen”, it is treated / considered as Sidewise. Aggressive Traders can take Long position near “Sell Gen” either retesting or crossed from Below & vice-versa i.e. can take Short position near “Buy Gen” either retesting or crossed downward from Above.
L#4: If the candle crossed & stays below the “Sell Gen”, it is treated / considered a Bearish bias.
L#5: Possibility / Probability of REVERSAL near RLS#1 & USTgt
HZB (Buy side) & HZS (Sell side) => Hurdle Zone,
*** Specialty of “HZB#1, HZB#2 HZS#1 & HZS#2” is Sidewise (behaviour in Nature)
Rest Plotted and Mentioned on Chart
Color code Used:
Green =. Positive bias.
Red =. Negative bias.
RED in Between Green means Trend Finder / Momentum Change
/ CYCLE Change and Vice Versa.
Notice One thing: HOW LEVELS are Working.
Use any Momentum Indicator / Oscillatoror as you "USED to" to Take entry.
⚠️ DISCLAIMER:
The information, views, and ideas shared here are purely for educational and informational purposes only. They are not intended as investment advice or a recommendation to buy, sell, or hold any financial instruments. I am not a SEBI-registered financial adviser.
Trading and investing in the stock market involves risk, and you should do your own research and analysis. You are solely responsible for any decisions made based on this research.
"As HARD EARNED MONEY IS YOUR's, So DECISION SHOULD HAVE TO BE YOUR's".
Do comment if Helpful.
In depth Analysis will be added later (If time Permits)
Note
📈 Last Hour Sentiment Analysis✅ Bullish Factors ✅
Strong Breakout: Nifty broke above September swing high of 25,470
Institutional Support: DIIs bought ₹4,076 crore vs FII inflows of ₹997 crore
Sector Rotation: Banking, Auto, FMCG showing strength
Technical Setup: Trading above all key EMAs (10, 20, 50-day)
RSI: 55.08 (Healthy bullish zone, room to move higher)
⚠️Cautionary Factors ⚠️
Global Weakness: Asian markets down (Nikkei -1.14%, Hang Seng -1.60%)
IT Sector Drag: Nifty IT down 1.33%, Wipro crashed 4.6%
Overbought Conditions: Some temporary overbought signals emerging
Weekly Expiry: Options expiry creating volatility
Related publications
Disclaimer
The information and publications are not meant to be, and do not constitute, financial, investment, trading, or other types of advice or recommendations supplied or endorsed by TradingView. Read more in the Terms of Use.
Related publications
Disclaimer
The information and publications are not meant to be, and do not constitute, financial, investment, trading, or other types of advice or recommendations supplied or endorsed by TradingView. Read more in the Terms of Use.