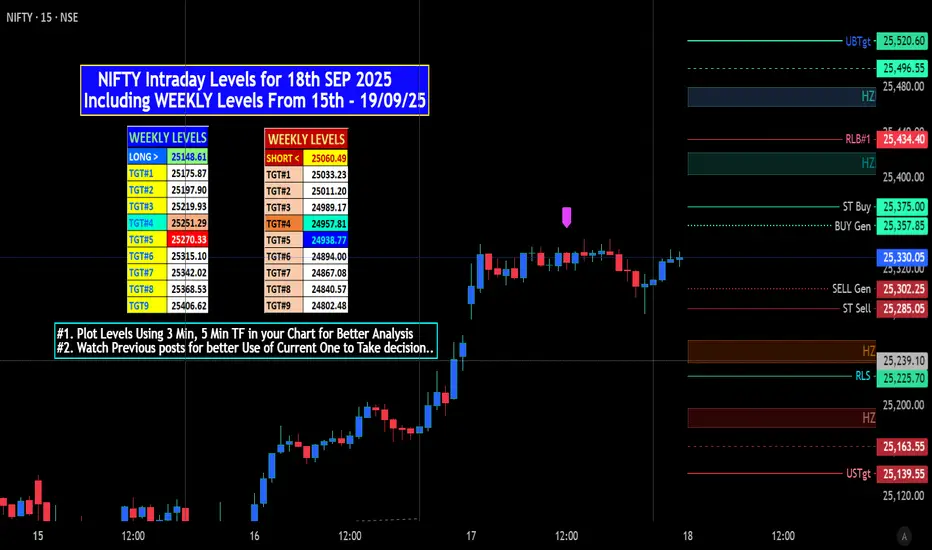
NIFTY Intraday Levels for 18th SEP 2025
Market Short View:
Nifty 50 Index is currently showing a Bullish Trend as indicated by the formation of an Ascending Channel. This pattern is characterized by Higher HIGHs and Higher LOWs, technically suggesting a continued UPward momentum. The price is well above 20 EMA 50EMA as well as 200 EMA, reinforcing the bullish sentiment.
Chart Patterns: Ascending Channel Higher HIGHs Higher LOW
Indicator View: Opportunity for further gains.
RSI < 70 => Overbought, Technical mening
CCI => 111.58 Crossed above 100 from Low.
MACD => witnessing a Bullish Crossover.
SWING levels:
Supports: 25090 – 24846 – 24530
Resistances: 25421 – 25670 – 25985
My personal View: NEUTRAL Stance.
# "WEEKLY Levels" mentioned in BOX format.
^^^^^^^Plot Levels Using 3 Min, 5 Min Time frame in your Chart for Better Analysis^^^^^^^
L#1: If the candle crossed & stays above the “Buy Gen”, it is treated / considered as Bullish bias.
L#2: Possibility / Probability of REVERSAL near RLB#1 & UBTgt
L#3: If the candle stays above “Sell Gen” but below “Buy Gen”, it is treated / considered as Sidewise. Aggressive Traders can take Long position near “Sell Gen” either retesting or crossed from Below & vice-versa i.e. can take Short position near “Buy Gen” either retesting or crossed downward from Above.
L#4: If the candle crossed & stays below the “Sell Gen”, it is treated / considered a Bearish bias.
L#5: Possibility / Probability of REVERSAL near RLS#1 & USTgt
HZB (Buy side) & HZS (Sell side) => Hurdle Zone,
*** Specialty of “HZB#1, HZB#2 HZS#1 & HZS#2” is Sidewise (behaviour in Nature)
Rest Plotted and Mentioned on Chart
Color code Used:
Green =. Positive bias.
Red =. Negative bias.
RED in Between Green means Trend Finder / Momentum Change
/ CYCLE Change and Vice Versa.
Notice One thing: HOW LEVELS are Working.
Use any Momentum Indicator / Oscillatoror as you "USED to" to Take entry.
📢 Disclaimer
I am not a SEBI-registered financial adviser.
The information, views, and ideas shared here are purely for educational and informational purposes only. They are not intended as investment advice or a recommendation to buy, sell, or hold any financial instruments.
Trading and investing in the stock market involves risk, and you should do your own research and analysis. You are solely responsible for any decisions made based on this research.
"As HARD EARNED MONEY IS YOUR's, So DECISION SHOULD HAVE TO BE YOUR's".
Trade active
Opened just above Reversal Level (in Chart mentioned as "RLB#1" @ 24435) and Fal below within some Seconds.Tested Several times But Fail to cross.
HAPPY TRADIMNG.
Related publications
Disclaimer
The information and publications are not meant to be, and do not constitute, financial, investment, trading, or other types of advice or recommendations supplied or endorsed by TradingView. Read more in the Terms of Use.
Related publications
Disclaimer
The information and publications are not meant to be, and do not constitute, financial, investment, trading, or other types of advice or recommendations supplied or endorsed by TradingView. Read more in the Terms of Use.