“শুভ সারদীয়া”
Technical Overview and Trade Setup for Nifty 50 Index (15-Minute Chart)
Technical Overview
• Price Action:
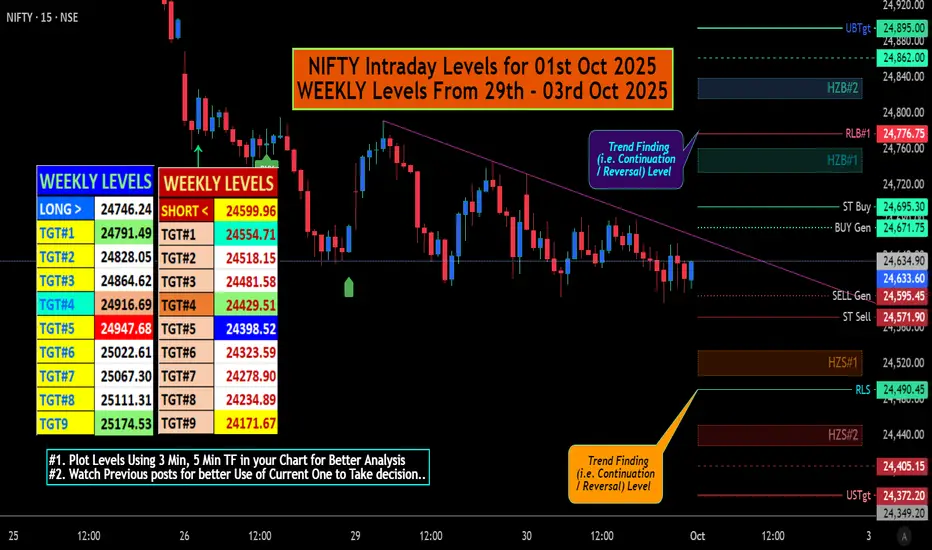
o The Nifty 50 Index started around 25,400 on September 22 and declined steadily to approximately 24,633.60 by the end of September 30.
o The downtrend features a series of lower highs and lower lows, with intermittent pullbacks (e.g., around September 25 and 29) followed by resumed declines.
o Candlestick patterns include several red (bearish) candles, with occasional blue (bullish) candles indicating short-term reversals or consolidation.
• Key Levels:
o Support: Plotted on Chart, though 24n500 -24, 532 can play Crucial Role.
o Resistance: Plotted on Chart. Though The pullback high around 25,090–25,200 (September 25) serves as a key resistance zone.
• Volume:
o Volume is relatively moderate, with a spike of 44.24M shares on September 30, suggesting increased selling pressure or interest near the close.
• Trend:
o The overall trend is bearish, with a steep decline of approximately 800+ points (~3.5 %) over the 8-day period.
o The 15-minute timeframe shows intraday volatility, but the broader direction remains downward.
Trade Setup
Based on the technical overview, here’s a potential trade setup for the Nifty 50 Index, focusing on the current bearish trend and considering the time (11:46 PM IST, post-market hours in India). This setup assumes continuation into the next trading session (October 1, 2025) and aligns with your interest in volatility (HV-IV context).
1. Short Trade (Bearish Continuation)
• Rationale:
o The downtrend is intact, with no significant reversal signals (e.g., bullish engulfing or strong support hold).
o Increased volume on September 30 suggests selling momentum, supporting a bearish outlook.
o HV may rise with this sharp move, while IV could spike if market uncertainty persists (e.g., post-close news or global cues).
# "WEEKLY Levels" mentioned in BOX format.
^^^^^^^Plot Levels Using 3 Min, 5 Min Time frame in your Chart for Better Analysis^^^^^^^
L#1: If the candle crossed & stays above the “Buy Gen”, it is treated / considered as Bullish bias.
L#2: Possibility / Probability of REVERSAL near RLB#1 & UBTgt
L#3: If the candle stays above “Sell Gen” but below “Buy Gen”, it is treated / considered as Sidewise. Aggressive Traders can take Long position near “Sell Gen” either retesting or crossed from Below & vice-versa i.e. can take Short position near “Buy Gen” either retesting or crossed downward from Above.
L#4: If the candle crossed & stays below the “Sell Gen”, it is treated / considered a Bearish bias.
L#5: Possibility / Probability of REVERSAL near RLS#1 & USTgt
HZB (Buy side) & HZS (Sell side) => Hurdle Zone,
*** Specialty of “HZB#1, HZB#2 HZS#1 & HZS#2” is Sidewise (behaviour in Nature)
Rest Plotted and Mentioned on Chart
Color code Used:
Green =. Positive bias.
Red =. Negative bias.
RED in Between Green means Trend Finder / Momentum Change
/ CYCLE Change and Vice Versa.
Notice One thing: HOW LEVELS are Working.
Use any Momentum Indicator / Oscillatoror as you "USED to" to Take entry.
⚠️ DISCLAIMER:
The information, views, and ideas shared here are purely for educational and informational purposes only. They are not intended as investment advice or a recommendation to buy, sell, or hold any financial instruments. I am not a SEBI-registered financial adviser.
Trading and investing in the stock market involves risk, and you should do your own research and analysis. You are solely responsible for any decisions made based on this research.
"As HARD EARNED MONEY IS YOUR's, So DECISION SHOULD HAVE TO BE YOUR's".
Do comment if Helpful.
Technical Overview and Trade Setup for Nifty 50 Index (15-Minute Chart)
Technical Overview
• Price Action:
o The Nifty 50 Index started around 25,400 on September 22 and declined steadily to approximately 24,633.60 by the end of September 30.
o The downtrend features a series of lower highs and lower lows, with intermittent pullbacks (e.g., around September 25 and 29) followed by resumed declines.
o Candlestick patterns include several red (bearish) candles, with occasional blue (bullish) candles indicating short-term reversals or consolidation.
• Key Levels:
o Support: Plotted on Chart, though 24n500 -24, 532 can play Crucial Role.
o Resistance: Plotted on Chart. Though The pullback high around 25,090–25,200 (September 25) serves as a key resistance zone.
• Volume:
o Volume is relatively moderate, with a spike of 44.24M shares on September 30, suggesting increased selling pressure or interest near the close.
• Trend:
o The overall trend is bearish, with a steep decline of approximately 800+ points (~3.5 %) over the 8-day period.
o The 15-minute timeframe shows intraday volatility, but the broader direction remains downward.
Trade Setup
Based on the technical overview, here’s a potential trade setup for the Nifty 50 Index, focusing on the current bearish trend and considering the time (11:46 PM IST, post-market hours in India). This setup assumes continuation into the next trading session (October 1, 2025) and aligns with your interest in volatility (HV-IV context).
1. Short Trade (Bearish Continuation)
• Rationale:
o The downtrend is intact, with no significant reversal signals (e.g., bullish engulfing or strong support hold).
o Increased volume on September 30 suggests selling momentum, supporting a bearish outlook.
o HV may rise with this sharp move, while IV could spike if market uncertainty persists (e.g., post-close news or global cues).
# "WEEKLY Levels" mentioned in BOX format.
^^^^^^^Plot Levels Using 3 Min, 5 Min Time frame in your Chart for Better Analysis^^^^^^^
L#1: If the candle crossed & stays above the “Buy Gen”, it is treated / considered as Bullish bias.
L#2: Possibility / Probability of REVERSAL near RLB#1 & UBTgt
L#3: If the candle stays above “Sell Gen” but below “Buy Gen”, it is treated / considered as Sidewise. Aggressive Traders can take Long position near “Sell Gen” either retesting or crossed from Below & vice-versa i.e. can take Short position near “Buy Gen” either retesting or crossed downward from Above.
L#4: If the candle crossed & stays below the “Sell Gen”, it is treated / considered a Bearish bias.
L#5: Possibility / Probability of REVERSAL near RLS#1 & USTgt
HZB (Buy side) & HZS (Sell side) => Hurdle Zone,
*** Specialty of “HZB#1, HZB#2 HZS#1 & HZS#2” is Sidewise (behaviour in Nature)
Rest Plotted and Mentioned on Chart
Color code Used:
Green =. Positive bias.
Red =. Negative bias.
RED in Between Green means Trend Finder / Momentum Change
/ CYCLE Change and Vice Versa.
Notice One thing: HOW LEVELS are Working.
Use any Momentum Indicator / Oscillatoror as you "USED to" to Take entry.
⚠️ DISCLAIMER:
The information, views, and ideas shared here are purely for educational and informational purposes only. They are not intended as investment advice or a recommendation to buy, sell, or hold any financial instruments. I am not a SEBI-registered financial adviser.
Trading and investing in the stock market involves risk, and you should do your own research and analysis. You are solely responsible for any decisions made based on this research.
"As HARD EARNED MONEY IS YOUR's, So DECISION SHOULD HAVE TO BE YOUR's".
Do comment if Helpful.
Related publications
Disclaimer
The information and publications are not meant to be, and do not constitute, financial, investment, trading, or other types of advice or recommendations supplied or endorsed by TradingView. Read more in the Terms of Use.
Related publications
Disclaimer
The information and publications are not meant to be, and do not constitute, financial, investment, trading, or other types of advice or recommendations supplied or endorsed by TradingView. Read more in the Terms of Use.