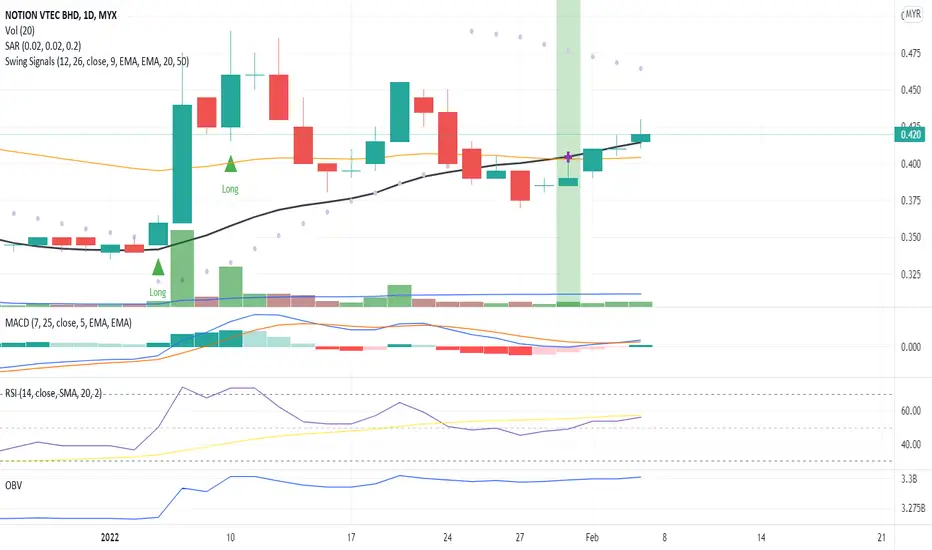
The candlestick body trend indicates an uptrend pattern where it closed above the MA20 line with volume below MA20.
The RSI is above 50 indicating a long-term uptrend momentum.
MACD and OBV indicate a divergence pattern, a beginning of an uptrend pattern.
Let's save NOTION to WL and watch out for significate price movement with volume where it continues the price momentum towards the next price resistance.
R 0.435
S 0.405
Disclaimer
The information and publications are not meant to be, and do not constitute, financial, investment, trading, or other types of advice or recommendations supplied or endorsed by TradingView. Read more in the Terms of Use.
Disclaimer
The information and publications are not meant to be, and do not constitute, financial, investment, trading, or other types of advice or recommendations supplied or endorsed by TradingView. Read more in the Terms of Use.