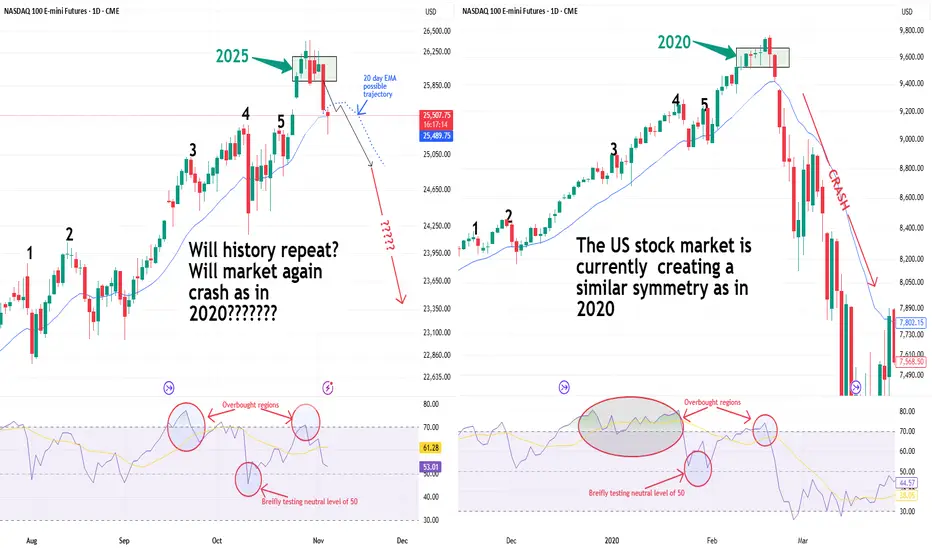
The NASDAQ 100 is creating a similar price action symmetry and RSI behavior to the pattern seen just before the 2020 crash.
* In 2020, this setup led to a sharp correction.
* In 2025, the symmetry looks almost identical.
Is it déjà vu — or just another pause before the next leg up?
* In 2020, this setup led to a sharp correction.
* In 2025, the symmetry looks almost identical.
Is it déjà vu — or just another pause before the next leg up?
Certified Market Technician
WA: +33755531401 +971545965565
marketinvestopedia.com/
WA: +33755531401 +971545965565
marketinvestopedia.com/
Disclaimer
The information and publications are not meant to be, and do not constitute, financial, investment, trading, or other types of advice or recommendations supplied or endorsed by TradingView. Read more in the Terms of Use.