NVDA – Coiling Tight for a Big Move as Gamma Levels Draw the Battle Lines ⚡️
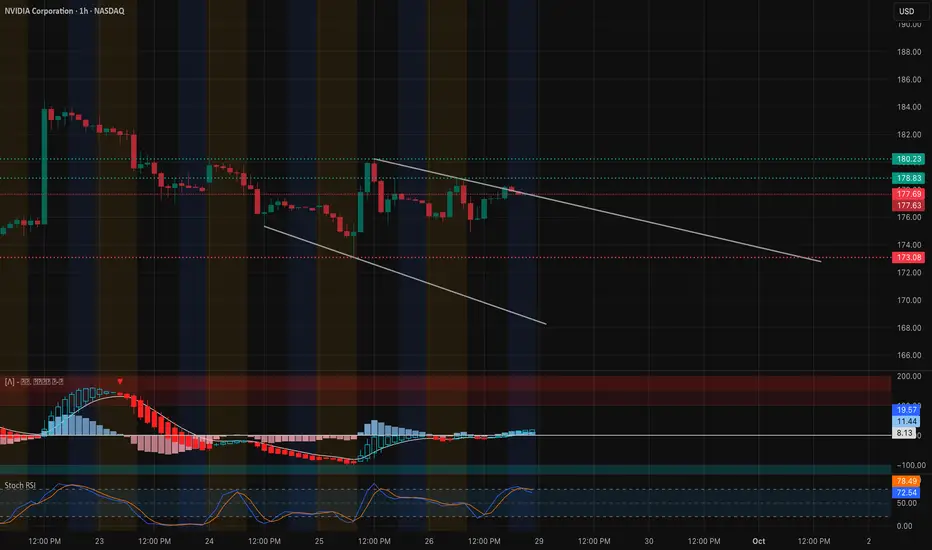
1-Hour Technical Outlook NVIDIA has been grinding inside a narrowing descending channel after its recent selloff, with intraday price now stabilizing around $177–$178. A series of higher lows over the last two sessions hint at basing, but the short-term downtrend line from the $185 zone still caps upside. MACD histogram just turned positive and the Stoch RSI is pointing higher, signaling an early shift in momentum. Immediate resistance sits at $180.2, followed by the heavy supply zone between $182.5 and $185. Key support levels are $175 (short-term pivot) and $172–$170 (structural demand).
Gamma Exposure (GEX) Confirmation

The options landscape reinforces these technical pivots:
* Major Call Wall / Max positive GEX is stacked at $185, with ~45% of call positioning concentrated there.
* Secondary call concentration: $182.5 (~39% call wall).
* Strong put support: $172.5 and $170, matching the lower trend channel and recent lows.
This setup suggests a gamma squeeze could ignite if NVDA breaks and holds above $180.2, where dealer hedging may accelerate upside toward $182.5–$185. Conversely, a loss of $175 would expose $172 and potentially $170 as downside magnets.
Trade Ideas & Option Plays for This Week
* Bullish Setup: Long above $180.2 with targets at $182.5 and $185. Ideal options: 1-week 180 or 182.5 calls, or 180/185 debit spreads to lower premium.
* Bearish Scenario: Breakdown below $175 opens room to $172 and $170. Traders can look at short-dated puts or vertical spreads such as 175/170.
* With IVR around 5.3 and IVx near 39, premiums are still modest—an advantage for debit spreads.
My Take:
NVDA is in a classic coiling pattern. Momentum oscillators are leaning bullish, but price must clear $180.2 to validate a trend reversal. The gamma map perfectly matches these breakout levels, giving confidence to the setup. Keep a tight stop below $175 if going long, and be ready to flip short if sellers reclaim control.
Disclaimer: This analysis is for educational purposes only and does not constitute financial advice. Always do your own research and manage risk before trading.
1-Hour Technical Outlook NVIDIA has been grinding inside a narrowing descending channel after its recent selloff, with intraday price now stabilizing around $177–$178. A series of higher lows over the last two sessions hint at basing, but the short-term downtrend line from the $185 zone still caps upside. MACD histogram just turned positive and the Stoch RSI is pointing higher, signaling an early shift in momentum. Immediate resistance sits at $180.2, followed by the heavy supply zone between $182.5 and $185. Key support levels are $175 (short-term pivot) and $172–$170 (structural demand).
Gamma Exposure (GEX) Confirmation
The options landscape reinforces these technical pivots:
* Major Call Wall / Max positive GEX is stacked at $185, with ~45% of call positioning concentrated there.
* Secondary call concentration: $182.5 (~39% call wall).
* Strong put support: $172.5 and $170, matching the lower trend channel and recent lows.
This setup suggests a gamma squeeze could ignite if NVDA breaks and holds above $180.2, where dealer hedging may accelerate upside toward $182.5–$185. Conversely, a loss of $175 would expose $172 and potentially $170 as downside magnets.
Trade Ideas & Option Plays for This Week
* Bullish Setup: Long above $180.2 with targets at $182.5 and $185. Ideal options: 1-week 180 or 182.5 calls, or 180/185 debit spreads to lower premium.
* Bearish Scenario: Breakdown below $175 opens room to $172 and $170. Traders can look at short-dated puts or vertical spreads such as 175/170.
* With IVR around 5.3 and IVx near 39, premiums are still modest—an advantage for debit spreads.
My Take:
NVDA is in a classic coiling pattern. Momentum oscillators are leaning bullish, but price must clear $180.2 to validate a trend reversal. The gamma map perfectly matches these breakout levels, giving confidence to the setup. Keep a tight stop below $175 if going long, and be ready to flip short if sellers reclaim control.
Disclaimer: This analysis is for educational purposes only and does not constitute financial advice. Always do your own research and manage risk before trading.
Disclaimer
The information and publications are not meant to be, and do not constitute, financial, investment, trading, or other types of advice or recommendations supplied or endorsed by TradingView. Read more in the Terms of Use.
Disclaimer
The information and publications are not meant to be, and do not constitute, financial, investment, trading, or other types of advice or recommendations supplied or endorsed by TradingView. Read more in the Terms of Use.
