NVDA Weekly Squeeze Setup 🔥
WEEKLY TIMEFRAME ANALYSIS
1. Market Structure
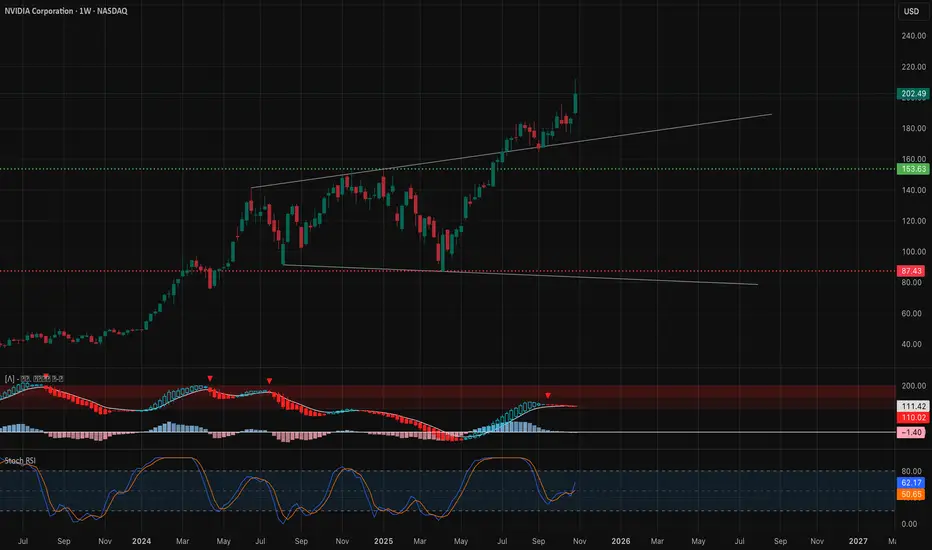
NVDA remains in a strong macro uptrend on the weekly. Recent BOS confirmations to the upside are intact, and the latest pullback retested the long-term ascending trendline perfectly. We’ve seen a subtle CHoCH attempt in prior weeks, but buyers stepped in aggressively on structure breaks. Liquidity remains stacked below around $153–$160, and smart money continues defending dips rather than chasing breakouts — a healthy sign of accumulation rather than distribution.
2. Supply & Demand / Order Blocks
There’s a key demand pocket sitting around $180–$190 from previous imbalance fills. The closest unmitigated bullish order block lives near $153 — that’s the nuclear level if we ever wash out. On the supply side, overhead inefficiency spans between $220–$230, where sellers historically rotate in. If price pushes into that region with thin volume, expect reactions.
3. Indicator Confluence
The 9EMA remains firmly above the 21EMA with a positive slope, confirming trend continuation. MACD histogram is still green, though showing early signs of momentum slowing — not reversal. RSI is elevated, but not at exhaustion levels. Weekly volume looks constructive; we’re not seeing blow-off distribution.
4. Weekly Tone
As long as NVDA stays above the weekly trendline near $195, bulls maintain control. Break below that, and things could get uncomfortable fast. The structure favors continuation, but expect profit-taking wicks.
DAILY TIMEFRAME ANALYSIS

1. Market Structure
Daily structure flipped bullish after a clean BOS from the prior swing high. The recent pullback respected support at $195.62 and reclaimed structure. Liquidity is still stacked at $190 and $184 — levels shorts would love to hunt. Smart money tends to dip price into these zones before running it into fresh highs.
2. Supply & Demand / Order Blocks
There’s a visible demand block at $184–$190 that has been tapped, but not fully mitigated. Supply overhead sits around $212–$217, which aligns with prior liquidity sweeps. If price pushes into that band with increasing volume, we could see continuation; otherwise, emotional wicks can form.
3. Indicator Confluence
9EMA curling sharply upward over the 21EMA — textbook bullish engine. MACD histogram shows expansion but with minor slowing bars; keep an eye on that slope. RSI remains healthy around mid–upper band, signaling momentum not overheated. Volume expansion shows the buyers aren’t exhausted yet.
4. Daily Tone
Bulls want to keep price above $200 to avoid gamma pressure on the downside. Below $198, we start inviting liquidity hunts.
15–MINUTE INTRADAY STRUCTURE

1. Market Structure
Short-term structure on 15m printed a CHoCH followed by BOS continuation into the closing session. We now have a small wedge structure forming just above intraday liquidity around $202.08–$202.36. If bulls defend these micro OBs, we can see a morning leg up.
Weak hands got shaken near $201, and smart money collected stops. Classic intraday accumulation profile.
2. Supply & Demand / Order Blocks
Demand sits at: • $202.30–$202.60 • $201.80–$202.10 Below that? $199–$200 is the bigger reload pocket.
Supply zones to watch: • $204.75–$205.10 • $207.90–$208.20
Everything in between is chop bait.
3. Indicator Confluence
9EMA trying to curl back up toward 21EMA. MACD histogram contracting to flat — sign of potential inflection. RSI pushing toward mid-band, which usually favors a scalp bounce early session if defended.
4. Intraday Tone
Expect a morning decision candle. If bulls can take $204.75 clean, we likely rotate into the $207 liquidity pocket.
GEX (Gamma Exposure) & OPTIONS SENTIMENT

Options flow favors call-side interest, with meaningful call walls stacked at: • $210 • $217.5 • $220
Gamma walls often behave like magnets when price gets within 1–2%.
Noteworthy negative gamma sits lower at: • $179–$180
If NVDA ever flushes below $195, dealers must hedge into downside momentum — accelerating moves. Conversely, above $205, dealer hedging acts as fuel for upside squeezes.
Max pain appears around $200 — this explains why price has gravitated around this area into the weekend.
How to use this: • Above $205 → scalp continuation long into $207–$210. • Below $200 → volatility spikes, favor puts.
Expect volatility compression between $200–$205 early week, then a directional release.
TRADE SCENARIOS (Nov. 3–7)
✅ Bullish Setup
Trigger: Break and hold above $204.75 Entry: Retest of $204.40–$204.60 Targets: $207.80 → $210 → potential wick into $217 Stop: Below $202.50
Invalidation: 15m CHoCH to downside at $202.10.
✅ Bearish Setup
Trigger: Break below $200 with heavy volume Entry: Retest of $200–$200.30 Targets: $195.60 → $190 liquidity sweep Stop: Above $202.50
Invalidation: reclaim of $204.75.
CLOSING OUTLOOK
This week sets up like a controlled grind with pockets of volatility. If bulls defend $200–$202 early, it can ignite a squeeze toward $210 and possibly tap the $217 gamma pocket. Failure at $200, especially with broad market weakness, flips this into a liquidity hunt down to $190.
Personally, I’m watching for liquidity traps around $202 early week — if I see absorption, I’ll lean long into call walls. But if we reject from $204.75 again with declining volume, expect a fast unwind.
DISCLAIMER
This analysis is for educational purposes only and does not constitute financial advice. Always manage risk and trade based on your own plan.
WEEKLY TIMEFRAME ANALYSIS
1. Market Structure
NVDA remains in a strong macro uptrend on the weekly. Recent BOS confirmations to the upside are intact, and the latest pullback retested the long-term ascending trendline perfectly. We’ve seen a subtle CHoCH attempt in prior weeks, but buyers stepped in aggressively on structure breaks. Liquidity remains stacked below around $153–$160, and smart money continues defending dips rather than chasing breakouts — a healthy sign of accumulation rather than distribution.
2. Supply & Demand / Order Blocks
There’s a key demand pocket sitting around $180–$190 from previous imbalance fills. The closest unmitigated bullish order block lives near $153 — that’s the nuclear level if we ever wash out. On the supply side, overhead inefficiency spans between $220–$230, where sellers historically rotate in. If price pushes into that region with thin volume, expect reactions.
3. Indicator Confluence
The 9EMA remains firmly above the 21EMA with a positive slope, confirming trend continuation. MACD histogram is still green, though showing early signs of momentum slowing — not reversal. RSI is elevated, but not at exhaustion levels. Weekly volume looks constructive; we’re not seeing blow-off distribution.
4. Weekly Tone
As long as NVDA stays above the weekly trendline near $195, bulls maintain control. Break below that, and things could get uncomfortable fast. The structure favors continuation, but expect profit-taking wicks.
DAILY TIMEFRAME ANALYSIS
1. Market Structure
Daily structure flipped bullish after a clean BOS from the prior swing high. The recent pullback respected support at $195.62 and reclaimed structure. Liquidity is still stacked at $190 and $184 — levels shorts would love to hunt. Smart money tends to dip price into these zones before running it into fresh highs.
2. Supply & Demand / Order Blocks
There’s a visible demand block at $184–$190 that has been tapped, but not fully mitigated. Supply overhead sits around $212–$217, which aligns with prior liquidity sweeps. If price pushes into that band with increasing volume, we could see continuation; otherwise, emotional wicks can form.
3. Indicator Confluence
9EMA curling sharply upward over the 21EMA — textbook bullish engine. MACD histogram shows expansion but with minor slowing bars; keep an eye on that slope. RSI remains healthy around mid–upper band, signaling momentum not overheated. Volume expansion shows the buyers aren’t exhausted yet.
4. Daily Tone
Bulls want to keep price above $200 to avoid gamma pressure on the downside. Below $198, we start inviting liquidity hunts.
15–MINUTE INTRADAY STRUCTURE
1. Market Structure
Short-term structure on 15m printed a CHoCH followed by BOS continuation into the closing session. We now have a small wedge structure forming just above intraday liquidity around $202.08–$202.36. If bulls defend these micro OBs, we can see a morning leg up.
Weak hands got shaken near $201, and smart money collected stops. Classic intraday accumulation profile.
2. Supply & Demand / Order Blocks
Demand sits at: • $202.30–$202.60 • $201.80–$202.10 Below that? $199–$200 is the bigger reload pocket.
Supply zones to watch: • $204.75–$205.10 • $207.90–$208.20
Everything in between is chop bait.
3. Indicator Confluence
9EMA trying to curl back up toward 21EMA. MACD histogram contracting to flat — sign of potential inflection. RSI pushing toward mid-band, which usually favors a scalp bounce early session if defended.
4. Intraday Tone
Expect a morning decision candle. If bulls can take $204.75 clean, we likely rotate into the $207 liquidity pocket.
GEX (Gamma Exposure) & OPTIONS SENTIMENT
Options flow favors call-side interest, with meaningful call walls stacked at: • $210 • $217.5 • $220
Gamma walls often behave like magnets when price gets within 1–2%.
Noteworthy negative gamma sits lower at: • $179–$180
If NVDA ever flushes below $195, dealers must hedge into downside momentum — accelerating moves. Conversely, above $205, dealer hedging acts as fuel for upside squeezes.
Max pain appears around $200 — this explains why price has gravitated around this area into the weekend.
How to use this: • Above $205 → scalp continuation long into $207–$210. • Below $200 → volatility spikes, favor puts.
Expect volatility compression between $200–$205 early week, then a directional release.
TRADE SCENARIOS (Nov. 3–7)
✅ Bullish Setup
Trigger: Break and hold above $204.75 Entry: Retest of $204.40–$204.60 Targets: $207.80 → $210 → potential wick into $217 Stop: Below $202.50
Invalidation: 15m CHoCH to downside at $202.10.
✅ Bearish Setup
Trigger: Break below $200 with heavy volume Entry: Retest of $200–$200.30 Targets: $195.60 → $190 liquidity sweep Stop: Above $202.50
Invalidation: reclaim of $204.75.
CLOSING OUTLOOK
This week sets up like a controlled grind with pockets of volatility. If bulls defend $200–$202 early, it can ignite a squeeze toward $210 and possibly tap the $217 gamma pocket. Failure at $200, especially with broad market weakness, flips this into a liquidity hunt down to $190.
Personally, I’m watching for liquidity traps around $202 early week — if I see absorption, I’ll lean long into call walls. But if we reject from $204.75 again with declining volume, expect a fast unwind.
DISCLAIMER
This analysis is for educational purposes only and does not constitute financial advice. Always manage risk and trade based on your own plan.
Trade active
NVDA Outlook for Nov. 4NVDA printed a CHoCH to the downside and is sitting right on the ascending trendline. Momentum continues to bleed lower, and MACD/Stoch both show sellers still in control. If price loses 206.30, we could see a move down toward 202.50 demand.
Support: 206.30 → 202.50 Resistance: 207.20 → 211.30
Bias: Slightly bearish unless price reclaims 207.20 with strength.
Trade Idea: Fade rejection near 207 for a short scalp toward 206 → 202.50. Bulls only take control if we break back above 211.30.
Disclaimer
The information and publications are not meant to be, and do not constitute, financial, investment, trading, or other types of advice or recommendations supplied or endorsed by TradingView. Read more in the Terms of Use.
Disclaimer
The information and publications are not meant to be, and do not constitute, financial, investment, trading, or other types of advice or recommendations supplied or endorsed by TradingView. Read more in the Terms of Use.