Will Bulls Reclaim $185 or Fade Back to $177? ⚡
1. Market Structure (1H & 15M)
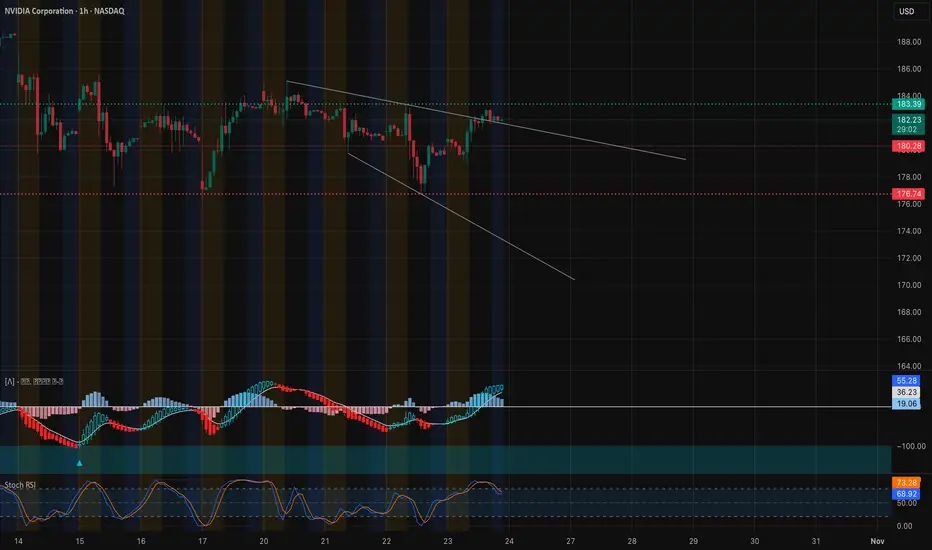
NVIDIA’s price action has been quietly building a potential bullish reversal structure. On the 1-hour chart, we’ve seen a clear Change of Character (CHoCH) off the $176–$177 demand zone, flipping prior BOS levels and reclaiming short-term control. This suggests smart money likely absorbed liquidity below $175 earlier in the week.
However, NVDA is still trading under a descending trendline from the mid-$180s highs. The latest 1H candle closed right below that resistance — meaning we’re at an inflection point heading into Friday. If bulls break above $183.50–$185, it confirms a structural shift toward higher highs. Failure here could keep NVDA locked in a range-bound corrective channel between $176–$183.
On the 15-minute chart,

we have multiple CHoCH and BOS confirmations in sequence — a bullish sign of internal structure rotation. Still, a recent CHoCH near $182.3 hints at possible profit-taking before the next leg.
2. Supply and Demand / Order Blocks
* Demand Zone (Active Buyer Base): $176.5–$178, which coincides with previous BOS lows and the last high-volume push.
* Short-Term Demand / Fair Value Gap Fill: $179–$180 — this could serve as the first bounce zone on any intraday dip.
* Supply Zone (Distribution Area): $183.5–$185. This is the key test area for bulls; a clean break and retest here could trigger acceleration toward $188+.
If sellers defend $185 again, expect a pullback toward $180. Momentum above that, however, exposes liquidity pockets up to $190–$192 (visible on the 1-hour gamma chart).
3. Indicator Confluence
* 9 EMA / 21 EMA: On the 15M, both EMAs have crossed bullishly with price still riding above — showing near-term strength. On the 1H, the crossover just occurred, confirming fresh momentum as long as NVDA stays above $180.
* MACD: Positive momentum expanding on the 1H chart, histogram rising with widening separation between signal lines. On 15M, momentum cooled slightly into close, likely just consolidation before next wave.
* RSI: Hovering near 70 on the 1H — strong but not yet overextended. The 15M RSI reset toward 50, providing room for another upside push.
* Volume: A steady increase through the $176–$182 leg suggests accumulation rather than distribution — a constructive sign for continuation.
4. GEX (Gamma Exposure) & Options Sentiment

From the GEX map, $185 is the highest positive gamma and call wall, acting as the main magnet/resistance for Friday (10/24). The HVL (High Volume Line) support sits right around $177.5, which aligns with demand and prior BOS zones.
On the downside, the 2nd and 3rd PUT walls are parked around $175 and $170, suggesting limited downside unless $176 breaks with force. Above $185, gamma positioning thins out — meaning a breakout could accelerate quickly toward $188–$190 as dealers hedge upward.
Current IVR is 16.1, with low implied volatility, and call sentiment at 17.3%, showing conservative bullish flow — not overheated. This is often where short gamma moves start to form if price expands beyond the main gamma wall.
In essence, $177 is the floor, $185 the ceiling, and whoever wins that range likely drives the end-of-week volatility.
5. Trade Scenarios for Friday, Oct. 24
Bullish Setup 🟩
* Entry Zone: $180–$181 on retest or breakout above $183.5
* Targets: $185 → $188 → $190
* Stop-Loss: Below $179
* Confirmation: Price holds above 9 EMA on 15M, MACD histogram stays positive, RSI > 55
Bearish Setup 🟥
* Entry Zone: $183.5–$185 rejection zone
* Targets: $180 → $177 → $175
* Stop-Loss: Above $186.5
* Confirmation: MACD flips red with RSI divergence on 15M, CHoCH back below $180
6. Closing Outlook for Oct. 24 (Friday)
Tomorrow, NVDA sits at a critical pivot. If buyers manage to push through $185 with volume, we could see a short-covering rally toward $188–$190 fueled by dealer hedging and gamma expansion. But if the breakout fails, $180 becomes the battleground for control again — and a break below that reopens the door to $177 and possibly $175.
My personal take: the chart favors bulls slightly, but only if $180 holds firm. Watch for a liquidity sweep below $180 early Friday followed by a rebound — that would be the most high-probability setup for a Friday squeeze into $185+.
🎯 Final Thought: “NVDA’s coiling under $185 resistance — the next breakout or rejection there decides if Friday ends with a quiet fade or an explosive push toward $190.”
1. Market Structure (1H & 15M)
NVIDIA’s price action has been quietly building a potential bullish reversal structure. On the 1-hour chart, we’ve seen a clear Change of Character (CHoCH) off the $176–$177 demand zone, flipping prior BOS levels and reclaiming short-term control. This suggests smart money likely absorbed liquidity below $175 earlier in the week.
However, NVDA is still trading under a descending trendline from the mid-$180s highs. The latest 1H candle closed right below that resistance — meaning we’re at an inflection point heading into Friday. If bulls break above $183.50–$185, it confirms a structural shift toward higher highs. Failure here could keep NVDA locked in a range-bound corrective channel between $176–$183.
On the 15-minute chart,
we have multiple CHoCH and BOS confirmations in sequence — a bullish sign of internal structure rotation. Still, a recent CHoCH near $182.3 hints at possible profit-taking before the next leg.
2. Supply and Demand / Order Blocks
* Demand Zone (Active Buyer Base): $176.5–$178, which coincides with previous BOS lows and the last high-volume push.
* Short-Term Demand / Fair Value Gap Fill: $179–$180 — this could serve as the first bounce zone on any intraday dip.
* Supply Zone (Distribution Area): $183.5–$185. This is the key test area for bulls; a clean break and retest here could trigger acceleration toward $188+.
If sellers defend $185 again, expect a pullback toward $180. Momentum above that, however, exposes liquidity pockets up to $190–$192 (visible on the 1-hour gamma chart).
3. Indicator Confluence
* 9 EMA / 21 EMA: On the 15M, both EMAs have crossed bullishly with price still riding above — showing near-term strength. On the 1H, the crossover just occurred, confirming fresh momentum as long as NVDA stays above $180.
* MACD: Positive momentum expanding on the 1H chart, histogram rising with widening separation between signal lines. On 15M, momentum cooled slightly into close, likely just consolidation before next wave.
* RSI: Hovering near 70 on the 1H — strong but not yet overextended. The 15M RSI reset toward 50, providing room for another upside push.
* Volume: A steady increase through the $176–$182 leg suggests accumulation rather than distribution — a constructive sign for continuation.
4. GEX (Gamma Exposure) & Options Sentiment
From the GEX map, $185 is the highest positive gamma and call wall, acting as the main magnet/resistance for Friday (10/24). The HVL (High Volume Line) support sits right around $177.5, which aligns with demand and prior BOS zones.
On the downside, the 2nd and 3rd PUT walls are parked around $175 and $170, suggesting limited downside unless $176 breaks with force. Above $185, gamma positioning thins out — meaning a breakout could accelerate quickly toward $188–$190 as dealers hedge upward.
Current IVR is 16.1, with low implied volatility, and call sentiment at 17.3%, showing conservative bullish flow — not overheated. This is often where short gamma moves start to form if price expands beyond the main gamma wall.
In essence, $177 is the floor, $185 the ceiling, and whoever wins that range likely drives the end-of-week volatility.
5. Trade Scenarios for Friday, Oct. 24
Bullish Setup 🟩
* Entry Zone: $180–$181 on retest or breakout above $183.5
* Targets: $185 → $188 → $190
* Stop-Loss: Below $179
* Confirmation: Price holds above 9 EMA on 15M, MACD histogram stays positive, RSI > 55
Bearish Setup 🟥
* Entry Zone: $183.5–$185 rejection zone
* Targets: $180 → $177 → $175
* Stop-Loss: Above $186.5
* Confirmation: MACD flips red with RSI divergence on 15M, CHoCH back below $180
6. Closing Outlook for Oct. 24 (Friday)
Tomorrow, NVDA sits at a critical pivot. If buyers manage to push through $185 with volume, we could see a short-covering rally toward $188–$190 fueled by dealer hedging and gamma expansion. But if the breakout fails, $180 becomes the battleground for control again — and a break below that reopens the door to $177 and possibly $175.
My personal take: the chart favors bulls slightly, but only if $180 holds firm. Watch for a liquidity sweep below $180 early Friday followed by a rebound — that would be the most high-probability setup for a Friday squeeze into $185+.
🎯 Final Thought: “NVDA’s coiling under $185 resistance — the next breakout or rejection there decides if Friday ends with a quiet fade or an explosive push toward $190.”
Trade active
Intraday Update (Oct 24)Price is consolidating inside a rising channel after a clean Break of Structure (BOS) near $185.9 earlier this morning. The structure remains bullish but slowing, suggesting possible consolidation before another leg higher.
* Current Price: $185.30
* Trend Structure: Higher lows within the ascending channel
* CHoCH Support: Around $184.3–$184.5 zone (acts as a short-term demand base).
* BOS Confirmation: $185.9 level remains key resistance — a breakout here could open room toward $187+.
* MACD: Momentum is cooling off; histogram shows flattening with signals converging — suggesting consolidation before next directional move.
* Stochastic RSI: Resetting near mid-levels, implying potential for another push if buyers defend support.
* Resistance: $186.00 → $187.20
* Support: $184.20 → $183.00
* Breakdown Risk: Below $182.8 could trigger liquidity sweep toward $181.8 zone.
NVDA is holding a tight bullish structure but momentum has softened intraday. If $184.3 holds, expect continuation toward $187 once momentum reactivates. However, a clean break under $183 would shift bias to short-term bearish retracement before possible rebound near $181.8.
Disclaimer
The information and publications are not meant to be, and do not constitute, financial, investment, trading, or other types of advice or recommendations supplied or endorsed by TradingView. Read more in the Terms of Use.
Disclaimer
The information and publications are not meant to be, and do not constitute, financial, investment, trading, or other types of advice or recommendations supplied or endorsed by TradingView. Read more in the Terms of Use.