Intraday Technical Outlook (15m Chart)
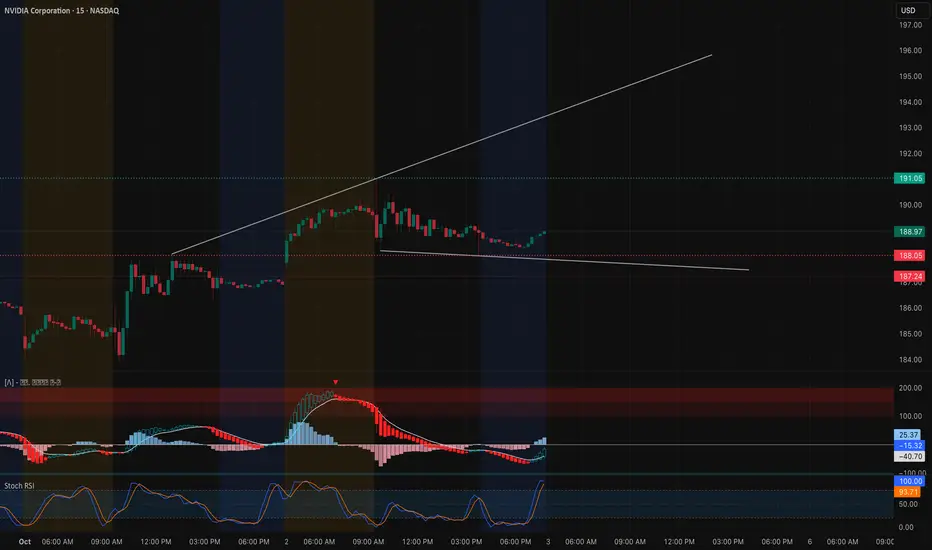
NVIDIA (NVDA) closed near $188.97, stabilizing after an intraday fade from the $191 zone. On the 15-minute chart, price action shows consolidation with buyers trying to defend key support:
* MACD: Flattening and curling back toward neutral, signaling momentum could flip positive if buyers step in early tomorrow.
* Stoch RSI: Pushed back into overbought levels, showing near-term buying strength but also risk of quick pullbacks.
* Key Levels: Support rests at $188–187.2, with stronger downside protection near $185. Resistance is set at $191–192, the prior high and channel top.
Intraday takeaway: NVDA is range-bound between $187 and $191. A breakout above $191 can accelerate toward $193–195, while a failure to hold $187.2 risks a slide back toward $185.
Options Sentiment & GEX Outlook (1H Chart)

The 1-hour GEX setup highlights a tight battle around current levels:
* Gamma Walls:
* $191–192.5: Strongest positive GEX / call wall cluster — key resistance zone.
* $187.5–185: Gamma pivot and support levels where buyers may defend.
* $180 / $175: Put wall supports if selling pressure intensifies.
* Implications:
* Sustaining above $188.5–189 keeps NVDA magnetized toward the $191–192.5 call wall.
* If $187.2 fails, dealer flows may drive price toward $185 and potentially $180.
* Volatility Context: IVR sits at 10.1 (very low), meaning options are cheap relative to history. This makes directional call/put buys attractive — but also means sellers risk getting trapped if momentum surges.
My Thoughts & Recommendation
For Oct 3 trading, NVDA sits at a gamma pivot with a tight setup:
* Intraday (scalping/trading): Longs favored above $188.5, targeting $191–192.5. Quick rejection at $191 can be shorted back to $187.2–185.
* Options trading (swing/0DTE): Calls make sense only above $189–190 for a breakout chase toward $193–195. If NVDA fails at $191 and dips below $187.2, puts targeting $185–180 have cleaner risk/reward.
Bias heading into Oct 3: Neutral-to-bullish, but watch $191 as the breakout test.
Disclaimer: This analysis is for educational purposes only and does not constitute financial advice. Always do your own research and manage risk before trading.
NVIDIA (NVDA) closed near $188.97, stabilizing after an intraday fade from the $191 zone. On the 15-minute chart, price action shows consolidation with buyers trying to defend key support:
* MACD: Flattening and curling back toward neutral, signaling momentum could flip positive if buyers step in early tomorrow.
* Stoch RSI: Pushed back into overbought levels, showing near-term buying strength but also risk of quick pullbacks.
* Key Levels: Support rests at $188–187.2, with stronger downside protection near $185. Resistance is set at $191–192, the prior high and channel top.
Intraday takeaway: NVDA is range-bound between $187 and $191. A breakout above $191 can accelerate toward $193–195, while a failure to hold $187.2 risks a slide back toward $185.
Options Sentiment & GEX Outlook (1H Chart)
The 1-hour GEX setup highlights a tight battle around current levels:
* Gamma Walls:
* $191–192.5: Strongest positive GEX / call wall cluster — key resistance zone.
* $187.5–185: Gamma pivot and support levels where buyers may defend.
* $180 / $175: Put wall supports if selling pressure intensifies.
* Implications:
* Sustaining above $188.5–189 keeps NVDA magnetized toward the $191–192.5 call wall.
* If $187.2 fails, dealer flows may drive price toward $185 and potentially $180.
* Volatility Context: IVR sits at 10.1 (very low), meaning options are cheap relative to history. This makes directional call/put buys attractive — but also means sellers risk getting trapped if momentum surges.
My Thoughts & Recommendation
For Oct 3 trading, NVDA sits at a gamma pivot with a tight setup:
* Intraday (scalping/trading): Longs favored above $188.5, targeting $191–192.5. Quick rejection at $191 can be shorted back to $187.2–185.
* Options trading (swing/0DTE): Calls make sense only above $189–190 for a breakout chase toward $193–195. If NVDA fails at $191 and dips below $187.2, puts targeting $185–180 have cleaner risk/reward.
Bias heading into Oct 3: Neutral-to-bullish, but watch $191 as the breakout test.
Disclaimer: This analysis is for educational purposes only and does not constitute financial advice. Always do your own research and manage risk before trading.
Disclaimer
The information and publications are not meant to be, and do not constitute, financial, investment, trading, or other types of advice or recommendations supplied or endorsed by TradingView. Read more in the Terms of Use.
Disclaimer
The information and publications are not meant to be, and do not constitute, financial, investment, trading, or other types of advice or recommendations supplied or endorsed by TradingView. Read more in the Terms of Use.