NVIDIA’s share price is experiencing an interesting run into the end of September as traders try and work out whether it can extend its run of gains through all time highs sitting just above the 184 level (184.55 Sept 22nd), a line in the sand that has capped the upside since the start of August (more on this in the technical update below).
With NVIDIA being the biggest company in the world by market capitalisation, currently sitting at a huge $4.34 trillion (No.2 Microsoft, $3.79 trillion), and it being the bellwether for AI performance, it’s not short of news flow to create periods of volatility.
Only on Monday, the company announced a $100 billion link up with Open AI to build new data centres and expand AI infrastructure together, which sent its stock price up 4% towards that 184 resistance, only for Federal Reserve Chairman Jerome Powell in a speech on Tuesday to send it back lower again as investors banked profits, when he offered a more cautious outlook towards future Fed rate cuts into the end of the year.
Looking into the end of the week, the focus may be on US economic data again, with the release of the final US Q2 GDP reading at 1330 BST today, and perhaps more importantly, the PCE index, which is the Fed’s preferred inflation gauge, due tomorrow at 1330 BST. Traders seem to be very sensitive to these inflation readings, given that they could determine whether the Fed is able to cut interest rates again before the end of 2025. Any deviation from expectations, to the up or downside could have an outsized impact on sentiment towards the NVIDIA stock price into the Friday close.
Technical Update: Watching Record Highs
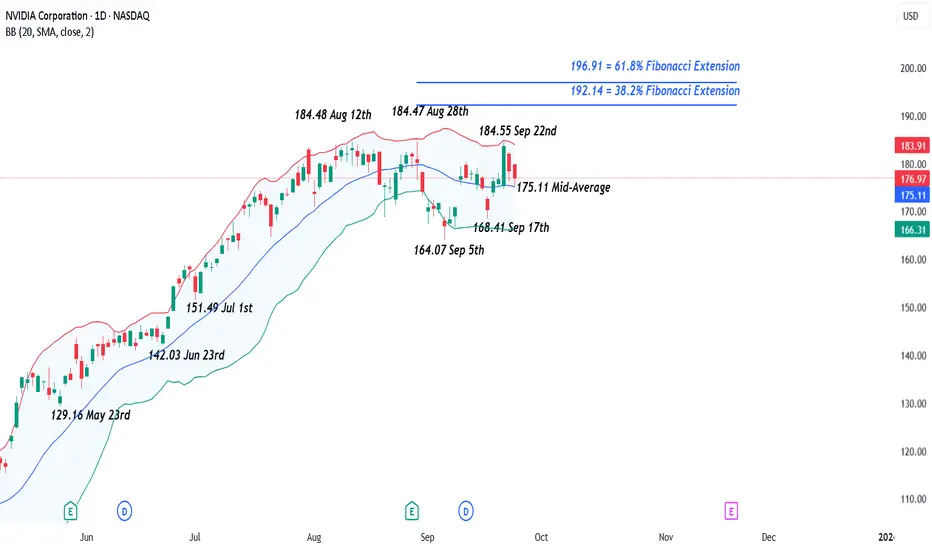
Since reaching its 184.48 high on August 12th, NVIDIA has twice attempted to break and close above this resistance, on August 28th and September 22nd. The latest attempt did set a new intraday high of 184.55, but as the chart below shows, resistance held again by the close, triggering another sell-off from that level.

This price action confirms the 184.48/184.55 range as a potentially key resistance area. A successful close above it could lead to a further phase of price strength.
While not a guarantee of continued upside, a closing break above 184.48/184.55 could open the path to 192.14, a level equal to the 38.2% Fibonacci extension. If this level were to also give way on a closing basis, the next resistance may prove to be 196.91, which is the higher 61.8% extension.
Of course, with resistance at 184.48/184.55 still capping price strength, there's also the risk that support levels could give way, possibly suggesting further downside in price activity.
Initial support may now be marked by 175.11, the Bollinger mid-average, which is currently containing the latest pullback in price. While a close below here may not confirm extended price weakness, it might open the door to test lower supports at 168.41, which is the September 17th low, possibly even 164.07, a level equal to the September 5th extreme.
The material provided here has not been prepared accordance with legal requirements designed to promote the independence of investment research and as such is considered to be a marketing communication. Whilst it is not subject to any prohibition on dealing ahead of the dissemination of investment research, we will not seek to take any advantage before providing it to our clients.
Pepperstone doesn’t represent that the material provided here is accurate, current or complete, and therefore shouldn’t be relied upon as such. The information, whether from a third party or not, isn’t to be considered as a recommendation; or an offer to buy or sell; or the solicitation of an offer to buy or sell any security, financial product or instrument; or to participate in any particular trading strategy. It does not take into account readers’ financial situation or investment objectives. We advise any readers of this content to seek their own advice. Without the approval of Pepperstone, reproduction or redistribution of this information isn’t permitted.
With NVIDIA being the biggest company in the world by market capitalisation, currently sitting at a huge $4.34 trillion (No.2 Microsoft, $3.79 trillion), and it being the bellwether for AI performance, it’s not short of news flow to create periods of volatility.
Only on Monday, the company announced a $100 billion link up with Open AI to build new data centres and expand AI infrastructure together, which sent its stock price up 4% towards that 184 resistance, only for Federal Reserve Chairman Jerome Powell in a speech on Tuesday to send it back lower again as investors banked profits, when he offered a more cautious outlook towards future Fed rate cuts into the end of the year.
Looking into the end of the week, the focus may be on US economic data again, with the release of the final US Q2 GDP reading at 1330 BST today, and perhaps more importantly, the PCE index, which is the Fed’s preferred inflation gauge, due tomorrow at 1330 BST. Traders seem to be very sensitive to these inflation readings, given that they could determine whether the Fed is able to cut interest rates again before the end of 2025. Any deviation from expectations, to the up or downside could have an outsized impact on sentiment towards the NVIDIA stock price into the Friday close.
Technical Update: Watching Record Highs
Since reaching its 184.48 high on August 12th, NVIDIA has twice attempted to break and close above this resistance, on August 28th and September 22nd. The latest attempt did set a new intraday high of 184.55, but as the chart below shows, resistance held again by the close, triggering another sell-off from that level.
This price action confirms the 184.48/184.55 range as a potentially key resistance area. A successful close above it could lead to a further phase of price strength.
While not a guarantee of continued upside, a closing break above 184.48/184.55 could open the path to 192.14, a level equal to the 38.2% Fibonacci extension. If this level were to also give way on a closing basis, the next resistance may prove to be 196.91, which is the higher 61.8% extension.
Of course, with resistance at 184.48/184.55 still capping price strength, there's also the risk that support levels could give way, possibly suggesting further downside in price activity.
Initial support may now be marked by 175.11, the Bollinger mid-average, which is currently containing the latest pullback in price. While a close below here may not confirm extended price weakness, it might open the door to test lower supports at 168.41, which is the September 17th low, possibly even 164.07, a level equal to the September 5th extreme.
The material provided here has not been prepared accordance with legal requirements designed to promote the independence of investment research and as such is considered to be a marketing communication. Whilst it is not subject to any prohibition on dealing ahead of the dissemination of investment research, we will not seek to take any advantage before providing it to our clients.
Pepperstone doesn’t represent that the material provided here is accurate, current or complete, and therefore shouldn’t be relied upon as such. The information, whether from a third party or not, isn’t to be considered as a recommendation; or an offer to buy or sell; or the solicitation of an offer to buy or sell any security, financial product or instrument; or to participate in any particular trading strategy. It does not take into account readers’ financial situation or investment objectives. We advise any readers of this content to seek their own advice. Without the approval of Pepperstone, reproduction or redistribution of this information isn’t permitted.
Global risk Warning CFDs are complex instruments and come with a high risk of losing money rapidly due to leverage. Between 74-89% of retail investor accounts lose money when trading in CFDs. You should consider whether you understand how CFD
Disclaimer
The information and publications are not meant to be, and do not constitute, financial, investment, trading, or other types of advice or recommendations supplied or endorsed by TradingView. Read more in the Terms of Use.