📈 Trade Plan (BUY Setup)
Parameter Value
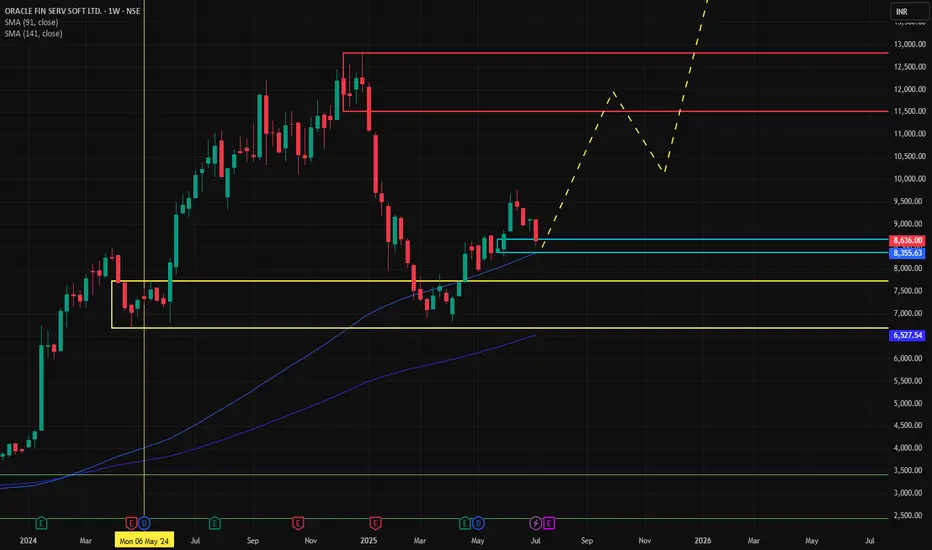
Entry Price 8565
Stop Loss (SL) 8365
Risk 200 pts
Target (Reward) 10234 pts
Target Price 18799
Risk:Reward (RR) 51.2
🔎 Reference Points
Last High: 12809
Last Low: 6819
Point Variation: 5990
✅ Key Takeaways
All trend indicators point strongly bullish from long to short term.
Entry at 8565 with a tight SL of 8365 offers a very high Risk:Reward ratio of 51.2, indicating a strong asymmetric trade opportunity.
The target of 18799 is significantly above the current price, which might be aggressive—make sure this aligns with your trading timeframe and risk profile.
The entry is supported by multiple demand zones across MTF and ITF levels, particularly around the 8500–8600 range.
🔢 Gann Levels Summary (Key Psychological Zones)
Gann Level Value
Long Above 7562
Short Below 7300
🔍 Interpretation & Integration with MTF Trade Plan
Current Entry in Trade Plan:
Your buy entry is at 8565, well above the Gann long trigger of 7562.
This confirms the bullish continuation above the Gann breakout level — indicating you're entering in the confirmed strength zone.
Gann Short Trigger:
7300 is significantly below current levels and also below the last low (6819).
If price ever breaks below this, it invalidates the bullish structure and can signal a trend reversal.
Gann as Confirmation Tool:
Use Gann level of 7562 as a reconfirmation level — if price dips but remains above this, bulls are still in control.
A retest of the 7562 level can offer re-entry opportunities with tighter stop-loss for better risk management.
✅ Conclusion
Your buy trade at 8565 is well-aligned with all major MTF, demand zones, and above Gann bullish breakout level of 7562.
As long as price stays above 7562, you’re in a strong uptrend zone.
If price falls below 7300, watch for structural weakness or reversal cues.
🔍 MTF Analysis Summary
All timeframes (HTF, MTF, ITF) indicate a strong upward trend.
📊 High Time Frame (HTF) - Long-Term Trend
Period Trend Analysis Proximal Distal Avg
Yearly UP OFSS Yearly Demand 4253 4020 4,137
Half-Yearly UP OFSS 6-Month Demand - RALLY RALLY 9737 9036 9,387
Quarterly UP Breakout + Quarterly Demand 4253 3510 3,882
HTF Avg 6081 5522 5802
🗓️ Mid Time Frame (MTF) - Medium-Term Trend
Period Trend Analysis Proximal Distal Avg
Monthly UP Monthly Demand (DMIP) 7736 6804 7,270
Weekly UP Weekly Demand (DMIP) 8661 8365 8,513
Daily UP Daily Demand (BUFL) 8590 8267 8,429
MTF Avg 8329 7812 8071
🕒 Intraday Time Frame (ITF) - Short-Term Trend
Period Trend Analysis Proximal Distal Avg
240 Min UP Demand Zone (DMIP) 8470 8267 8,369
180 Min UP Demand Zone (DMIP) 8491 8267 8,379
60 Min UP Demand Zone (DMIP) 8565 8544 8,555
ITF Avg 8509 8359 8434
Parameter Value
Entry Price 8565
Stop Loss (SL) 8365
Risk 200 pts
Target (Reward) 10234 pts
Target Price 18799
Risk:Reward (RR) 51.2
🔎 Reference Points
Last High: 12809
Last Low: 6819
Point Variation: 5990
✅ Key Takeaways
All trend indicators point strongly bullish from long to short term.
Entry at 8565 with a tight SL of 8365 offers a very high Risk:Reward ratio of 51.2, indicating a strong asymmetric trade opportunity.
The target of 18799 is significantly above the current price, which might be aggressive—make sure this aligns with your trading timeframe and risk profile.
The entry is supported by multiple demand zones across MTF and ITF levels, particularly around the 8500–8600 range.
🔢 Gann Levels Summary (Key Psychological Zones)
Gann Level Value
Long Above 7562
Short Below 7300
🔍 Interpretation & Integration with MTF Trade Plan
Current Entry in Trade Plan:
Your buy entry is at 8565, well above the Gann long trigger of 7562.
This confirms the bullish continuation above the Gann breakout level — indicating you're entering in the confirmed strength zone.
Gann Short Trigger:
7300 is significantly below current levels and also below the last low (6819).
If price ever breaks below this, it invalidates the bullish structure and can signal a trend reversal.
Gann as Confirmation Tool:
Use Gann level of 7562 as a reconfirmation level — if price dips but remains above this, bulls are still in control.
A retest of the 7562 level can offer re-entry opportunities with tighter stop-loss for better risk management.
✅ Conclusion
Your buy trade at 8565 is well-aligned with all major MTF, demand zones, and above Gann bullish breakout level of 7562.
As long as price stays above 7562, you’re in a strong uptrend zone.
If price falls below 7300, watch for structural weakness or reversal cues.
🔍 MTF Analysis Summary
All timeframes (HTF, MTF, ITF) indicate a strong upward trend.
📊 High Time Frame (HTF) - Long-Term Trend
Period Trend Analysis Proximal Distal Avg
Yearly UP OFSS Yearly Demand 4253 4020 4,137
Half-Yearly UP OFSS 6-Month Demand - RALLY RALLY 9737 9036 9,387
Quarterly UP Breakout + Quarterly Demand 4253 3510 3,882
HTF Avg 6081 5522 5802
🗓️ Mid Time Frame (MTF) - Medium-Term Trend
Period Trend Analysis Proximal Distal Avg
Monthly UP Monthly Demand (DMIP) 7736 6804 7,270
Weekly UP Weekly Demand (DMIP) 8661 8365 8,513
Daily UP Daily Demand (BUFL) 8590 8267 8,429
MTF Avg 8329 7812 8071
🕒 Intraday Time Frame (ITF) - Short-Term Trend
Period Trend Analysis Proximal Distal Avg
240 Min UP Demand Zone (DMIP) 8470 8267 8,369
180 Min UP Demand Zone (DMIP) 8491 8267 8,379
60 Min UP Demand Zone (DMIP) 8565 8544 8,555
ITF Avg 8509 8359 8434
Disclaimer
The information and publications are not meant to be, and do not constitute, financial, investment, trading, or other types of advice or recommendations supplied or endorsed by TradingView. Read more in the Terms of Use.
Disclaimer
The information and publications are not meant to be, and do not constitute, financial, investment, trading, or other types of advice or recommendations supplied or endorsed by TradingView. Read more in the Terms of Use.