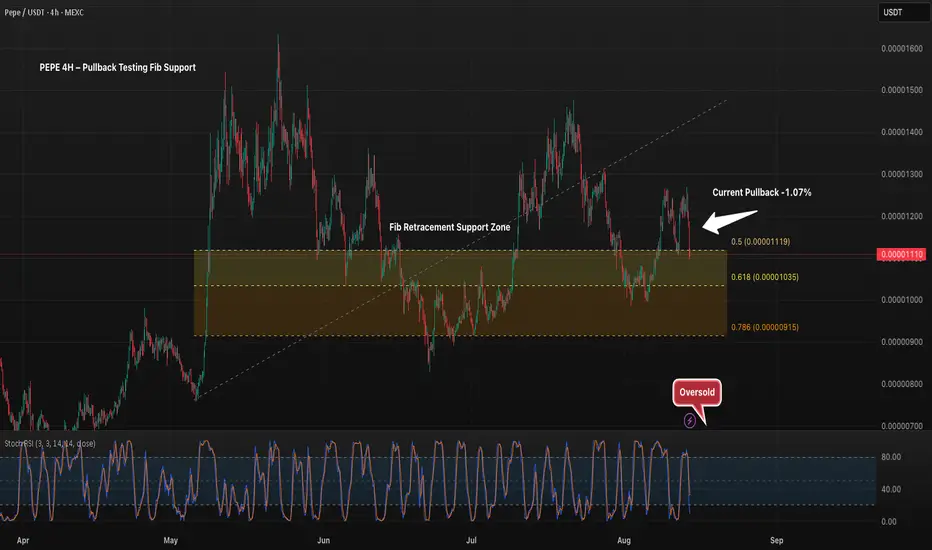
PEPE’s 4H chart shows price pulling back into the 0.5 Fibonacci retracement level near 0.00001119, with the next supports at 0.618 (0.00001035) and 0.786 (0.00000915). Stoch RSI is in oversold territory, signaling potential for a short-term bounce. A sustained hold above the 0.5 level could keep bullish momentum intact, while a breakdown increases risk of deeper retracement.
Explore 5,000 Strategies at quanttradingpro.com
Search for the most profitable, lowest risk by symbol!
Search by indicators like Supertrend, Ichimoku, macd.
Join our discord discord.gg/2systG9frc
We provide education & tools.
Search for the most profitable, lowest risk by symbol!
Search by indicators like Supertrend, Ichimoku, macd.
Join our discord discord.gg/2systG9frc
We provide education & tools.
Disclaimer
The information and publications are not meant to be, and do not constitute, financial, investment, trading, or other types of advice or recommendations supplied or endorsed by TradingView. Read more in the Terms of Use.