Key Observations:
1. Trendline Analysis:
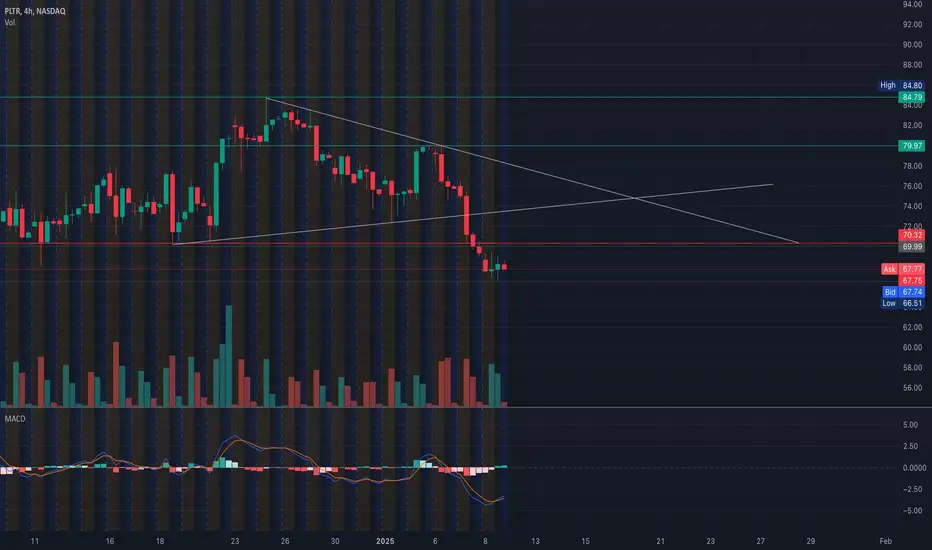
* PLTR is trading near a descending resistance trendline and approaching key support levels, indicating a potential continuation or reversal.
* The price action shows a narrowing wedge pattern, signaling an impending breakout or breakdown.
2. Support & Resistance Levels:
* Immediate support: $66.50 - $67.00
* Resistance levels:
* $70.00 (psychological and near-term resistance)
* $73.00 (next major hurdle)
* Below $66.50, the next significant support is $65.00.
3. Volume and MACD Analysis:
* Recent selling pressure is evident from increasing volume during downward movements.
* MACD is in a bearish alignment, but signs of a potential crossover indicate slowing bearish momentum.
4. Gamma Exposure (GEX):

* Negative Gamma Levels dominate, with the highest negative NETGEX at $70.00, suggesting heavy put activity.
* Support and Resistance Walls:
* PUT Wall: $67.00 and $65.00
* CALL Wall: $70.00 and $73.00
* Options activity indicates bearish sentiment but with the potential for volatility spikes near key gamma levels.
Scenarios and Trade Ideas:
1. Bullish Scenario:
* A breakout above $70.00 could target $73.00 and potentially $75.00.
* Entry: Above $70.00 with stop-loss at $68.00.
* Take profit: $73.00 - $75.00.
2. Bearish Scenario:
* A breakdown below $66.50 could accelerate towards $65.00 and even $62.00 in an extended sell-off.
* Entry: Below $66.50 with stop-loss at $68.00.
* Take profit: $65.00 - $62.00.
3. Neutral/Volatility Play:
* Monitor price action within $66.50 - $70.00. Consolidation in this range might precede a strong directional move.
Conclusion:
PLTR's price action and GEX levels suggest heightened volatility near the current zone. A decisive breakout above $70.00 or a breakdown below $66.50 could offer trading opportunities. Stay cautious with position sizing and consider options strategies like straddles or vertical spreads to capture directional or volatility moves.
Disclaimer: This analysis is for educational purposes only and does not constitute financial advice. Conduct your own research and consult with a financial advisor before trading.
1. Trendline Analysis:
* PLTR is trading near a descending resistance trendline and approaching key support levels, indicating a potential continuation or reversal.
* The price action shows a narrowing wedge pattern, signaling an impending breakout or breakdown.
2. Support & Resistance Levels:
* Immediate support: $66.50 - $67.00
* Resistance levels:
* $70.00 (psychological and near-term resistance)
* $73.00 (next major hurdle)
* Below $66.50, the next significant support is $65.00.
3. Volume and MACD Analysis:
* Recent selling pressure is evident from increasing volume during downward movements.
* MACD is in a bearish alignment, but signs of a potential crossover indicate slowing bearish momentum.
4. Gamma Exposure (GEX):
* Negative Gamma Levels dominate, with the highest negative NETGEX at $70.00, suggesting heavy put activity.
* Support and Resistance Walls:
* PUT Wall: $67.00 and $65.00
* CALL Wall: $70.00 and $73.00
* Options activity indicates bearish sentiment but with the potential for volatility spikes near key gamma levels.
Scenarios and Trade Ideas:
1. Bullish Scenario:
* A breakout above $70.00 could target $73.00 and potentially $75.00.
* Entry: Above $70.00 with stop-loss at $68.00.
* Take profit: $73.00 - $75.00.
2. Bearish Scenario:
* A breakdown below $66.50 could accelerate towards $65.00 and even $62.00 in an extended sell-off.
* Entry: Below $66.50 with stop-loss at $68.00.
* Take profit: $65.00 - $62.00.
3. Neutral/Volatility Play:
* Monitor price action within $66.50 - $70.00. Consolidation in this range might precede a strong directional move.
Conclusion:
PLTR's price action and GEX levels suggest heightened volatility near the current zone. A decisive breakout above $70.00 or a breakdown below $66.50 could offer trading opportunities. Stay cautious with position sizing and consider options strategies like straddles or vertical spreads to capture directional or volatility moves.
Disclaimer: This analysis is for educational purposes only and does not constitute financial advice. Conduct your own research and consult with a financial advisor before trading.
Disclaimer
The information and publications are not meant to be, and do not constitute, financial, investment, trading, or other types of advice or recommendations supplied or endorsed by TradingView. Read more in the Terms of Use.
Disclaimer
The information and publications are not meant to be, and do not constitute, financial, investment, trading, or other types of advice or recommendations supplied or endorsed by TradingView. Read more in the Terms of Use.