Testing the $616 Resistance Wall 🚀
📆 Daily Chart — Macro Structure and Market Context
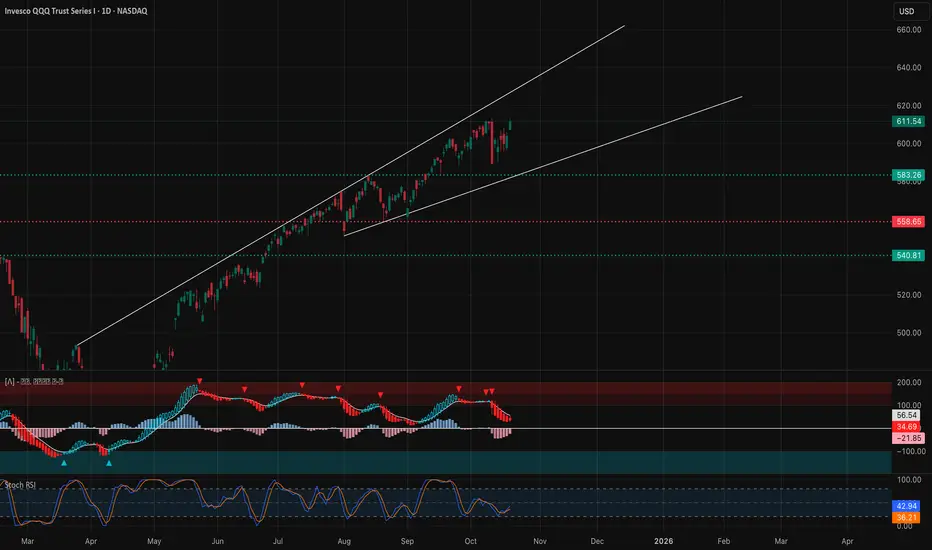
Market Structure: The NASDAQ ETF (QQQ) continues to ride a steady ascending channel since March, maintaining a higher-low structure. The recent CHoCH at $583 was followed by a rebound and BOS (Break of Structure) above $600, confirming that the pullback phase has likely completed.
Price is now pressing into the upper channel resistance near $611–$616, which coincides with heavy liquidity and prior supply zones. Despite the overhead resistance, the broader structure remains bullish, with price action consolidating in the upper half of the channel — a typical mid-trend continuation behavior.
Supply & Demand / Order Blocks:
* Demand Zone: $583–$590 (key defended base from last CHoCH).
* Mid-Demand Zone: $558–$560 (38% fib + historical OB).
* Supply Zone: $611–$616 (upper channel cap and recent BOS level).
Indicator Confluence:
* 9 EMA > 21 EMA: bullish alignment with widening slope.
* MACD: Momentum recovering from midline, histogram expanding positively.
* Stoch RSI: Mid-range reset around 43 — plenty of room to rise.
* Volume: Rising on breakout days, confirming accumulation.
The daily chart suggests a continuation setup with bullish pressure intact. As long as QQQ holds above $600, bulls control the trend toward $616–$620.
⏱️ 1-Hour Chart — Near-Term Trend and Swing Setup

Market Structure: The 1-hour view highlights a strong recovery leg after multiple CHoCH → BOS sequences. Price broke out of a descending wedge and reclaimed the $608–$610 level, a crucial pivot area aligned with gamma resistance.
Currently, QQQ is consolidating beneath the $612–$616 resistance wall. A clean breakout with volume could trigger a test of the upper trendline near $620.
Supply & Demand / OB Zones:
* Demand Zone: $605–$608 (retest area for dip buyers).
* Supply Zone: $612–$616 (active resistance zone).
Indicator Confluence:
* 9 EMA > 21 EMA: bull control intact.
* MACD: still strong, histogram shows gradual expansion.
* Stoch RSI: hovering near overbought but showing no divergence yet.
Trade Scenarios:
* Bullish Setup: Buy dips near $606–$608 → Target $616 / $620 → Stop $601.
* Bearish Setup: Short rejection at $616 → Target $605 / $600 → Stop $618.
A close above $616 opens the door for momentum continuation toward $622–$625, while losing $605 would likely trigger a retest of $590 demand.
🕒 15-Minute Chart — Intraday Scalping Structure

Market Structure: The 15-min chart reveals QQQ’s short-term compression after a morning rally. Price remains within a rising micro-channel but is stalling near resistance at $612–$614. Several BOS patterns confirm trend continuation, while the latest CHoCH at $611.3 marks minor cooling.
This looks like a controlled pullback rather than a reversal, with liquidity building around $610.
Supply & Demand / OB Levels:
* Demand Zone: $608–$610 (intraday support and EMA confluence).
* Supply Zone: $614–$616 (scalp resistance).
Indicator Confluence:
* 9 EMA vs 21 EMA: still trending upward but flattening slightly.
* MACD: weakening histogram — possible short-term cooldown.
* Stoch RSI: cycling down from overbought, indicating temporary pause.
Scalp Plan:
* Bullish Bias: Buy near $609–$610 → Target $614 → Stop $607.
* Bearish Bias: Short rejection from $614–$615 → Target $609 → Stop $616.
Expect small consolidation before breakout. Trend remains bullish until $608 breaks decisively.
📊 GEX (Gamma Exposure) & Options Sentiment

The GEX structure shows heavy call positioning at $612–$616, with a clear gamma ceiling near $616 — currently acting as resistance. Below $604 lies the highest liquidity void (HVL) where dealers might provide support.
Key GEX Levels:
* Highest Positive GEX / Call Wall: $616 (major gamma resistance).
* 2nd Call Wall: $613.
* Put Wall / Support: $604 and $593 (dealer hedging floors).
* IVR: 22.9 — low, suggesting compression and potential volatility pop.
* Put/Call Ratio: 48.5% puts — slightly bearish skew but stabilizing.
Dealers are in neutral gamma territory, meaning price may grind within $604–$616 until a breakout forces delta hedging momentum in either direction.
🎯 Closing Outlook
The broader QQQ structure remains bullish inside an uptrend channel, supported by strong demand zones and recovering momentum indicators. The short-term price action is coiling for a potential breakout above $616 — a key level to watch for momentum confirmation.
As long as QQQ holds above $605, the trend bias stays bullish toward $620–$625. If $604 breaks, expect a deeper pullback to $590 before buyers re-engage.
Disclaimer: This analysis is for educational purposes only and not financial advice. Always perform your own due diligence and manage your risk carefully.
📆 Daily Chart — Macro Structure and Market Context
Market Structure: The NASDAQ ETF (QQQ) continues to ride a steady ascending channel since March, maintaining a higher-low structure. The recent CHoCH at $583 was followed by a rebound and BOS (Break of Structure) above $600, confirming that the pullback phase has likely completed.
Price is now pressing into the upper channel resistance near $611–$616, which coincides with heavy liquidity and prior supply zones. Despite the overhead resistance, the broader structure remains bullish, with price action consolidating in the upper half of the channel — a typical mid-trend continuation behavior.
Supply & Demand / Order Blocks:
* Demand Zone: $583–$590 (key defended base from last CHoCH).
* Mid-Demand Zone: $558–$560 (38% fib + historical OB).
* Supply Zone: $611–$616 (upper channel cap and recent BOS level).
Indicator Confluence:
* 9 EMA > 21 EMA: bullish alignment with widening slope.
* MACD: Momentum recovering from midline, histogram expanding positively.
* Stoch RSI: Mid-range reset around 43 — plenty of room to rise.
* Volume: Rising on breakout days, confirming accumulation.
The daily chart suggests a continuation setup with bullish pressure intact. As long as QQQ holds above $600, bulls control the trend toward $616–$620.
⏱️ 1-Hour Chart — Near-Term Trend and Swing Setup
Market Structure: The 1-hour view highlights a strong recovery leg after multiple CHoCH → BOS sequences. Price broke out of a descending wedge and reclaimed the $608–$610 level, a crucial pivot area aligned with gamma resistance.
Currently, QQQ is consolidating beneath the $612–$616 resistance wall. A clean breakout with volume could trigger a test of the upper trendline near $620.
Supply & Demand / OB Zones:
* Demand Zone: $605–$608 (retest area for dip buyers).
* Supply Zone: $612–$616 (active resistance zone).
Indicator Confluence:
* 9 EMA > 21 EMA: bull control intact.
* MACD: still strong, histogram shows gradual expansion.
* Stoch RSI: hovering near overbought but showing no divergence yet.
Trade Scenarios:
* Bullish Setup: Buy dips near $606–$608 → Target $616 / $620 → Stop $601.
* Bearish Setup: Short rejection at $616 → Target $605 / $600 → Stop $618.
A close above $616 opens the door for momentum continuation toward $622–$625, while losing $605 would likely trigger a retest of $590 demand.
🕒 15-Minute Chart — Intraday Scalping Structure
Market Structure: The 15-min chart reveals QQQ’s short-term compression after a morning rally. Price remains within a rising micro-channel but is stalling near resistance at $612–$614. Several BOS patterns confirm trend continuation, while the latest CHoCH at $611.3 marks minor cooling.
This looks like a controlled pullback rather than a reversal, with liquidity building around $610.
Supply & Demand / OB Levels:
* Demand Zone: $608–$610 (intraday support and EMA confluence).
* Supply Zone: $614–$616 (scalp resistance).
Indicator Confluence:
* 9 EMA vs 21 EMA: still trending upward but flattening slightly.
* MACD: weakening histogram — possible short-term cooldown.
* Stoch RSI: cycling down from overbought, indicating temporary pause.
Scalp Plan:
* Bullish Bias: Buy near $609–$610 → Target $614 → Stop $607.
* Bearish Bias: Short rejection from $614–$615 → Target $609 → Stop $616.
Expect small consolidation before breakout. Trend remains bullish until $608 breaks decisively.
📊 GEX (Gamma Exposure) & Options Sentiment
The GEX structure shows heavy call positioning at $612–$616, with a clear gamma ceiling near $616 — currently acting as resistance. Below $604 lies the highest liquidity void (HVL) where dealers might provide support.
Key GEX Levels:
* Highest Positive GEX / Call Wall: $616 (major gamma resistance).
* 2nd Call Wall: $613.
* Put Wall / Support: $604 and $593 (dealer hedging floors).
* IVR: 22.9 — low, suggesting compression and potential volatility pop.
* Put/Call Ratio: 48.5% puts — slightly bearish skew but stabilizing.
Dealers are in neutral gamma territory, meaning price may grind within $604–$616 until a breakout forces delta hedging momentum in either direction.
🎯 Closing Outlook
The broader QQQ structure remains bullish inside an uptrend channel, supported by strong demand zones and recovering momentum indicators. The short-term price action is coiling for a potential breakout above $616 — a key level to watch for momentum confirmation.
As long as QQQ holds above $605, the trend bias stays bullish toward $620–$625. If $604 breaks, expect a deeper pullback to $590 before buyers re-engage.
Disclaimer: This analysis is for educational purposes only and not financial advice. Always perform your own due diligence and manage your risk carefully.
Disclaimer
The information and publications are not meant to be, and do not constitute, financial, investment, trading, or other types of advice or recommendations supplied or endorsed by TradingView. Read more in the Terms of Use.
Disclaimer
The information and publications are not meant to be, and do not constitute, financial, investment, trading, or other types of advice or recommendations supplied or endorsed by TradingView. Read more in the Terms of Use.