Been awhile since I went over Tech..
Let's start off with a bigger picture
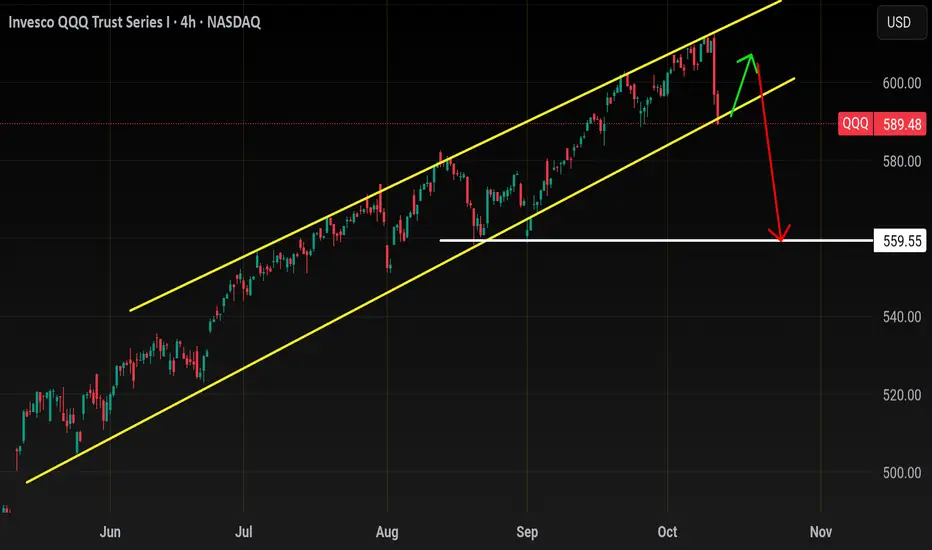
Zooming out you can see that we've tagged our long term resistance since sept

Zooming in but staying on the weekly
You'll notice the reversal weekly bearish engulfing and also the volume..

The candle alone is is nasty, but that volume is a bad. The most volume we've seen since april rebound and it's bearish..
So with that being I think are headed back to 558 minimum. And also I think this moves happens before November 1st.
Nov to late Dec normally isn't to kind to bears and also we would be in the middle of tech earnings so I don't like to short the market during bullish Seasonality + earnings season.
So
Let me show you my steps one by one how I come up with my tech homework/trades
Step one Identify where your
Moving averages
Price action
Fib levels are
Start on daily time frame
I like to use my 20/50ma

The 20ma resistance will be 599-600
The 50ma support will be 582
Next I add the fib levels on my chart starting from all time high and going back lower to that launch pad at 558.. some people go back further and lower than 558 but those levels aren't ACTIONABLE for day trading or swinging weeklies. I need to know where proce can go for the next 3 sessions or next 3%

So fib levels confirm the moving average levels
As you can see 601 .786 fib level will match up closely with the 599 20sma Resistance
The 579 .382 will match nicely with the 50sma
When I say match , what I mean is let's say I short Qqq on a rebound at 599, I would be will to add another put all the way up to its next resistance at 601 if needed and then I could place a 20% loss behind 601.
Similar to if I was to buy calls at 582 50sma for a nice bounce, I would be willing to add more calls all the down to 579 gap close or .382 fib with a 20% stop below that..
This method of positioning gives you a back up plan and prevents paper hand trading.
Lastly let's look at just price action and trend lines..
For that we'll have to go down the hourly time frame (2hour chart)

Some people would argue upon seeing this trendline retest that it's a great buy area, and I would agree short term it may bounce but being up at the weekly trendline I think this summer uptrend gives way this week or next.
1hour chart

This is where I just look at price action and volume. I look for areas with a lot of traffic and heavy volume
.
Going into next week you can see its alot of support at 588 and I circled in green the previous volume that came into that area.
Overhead resistance will be the 200sma at 592 and support at 588.. over 593 and 596 comes but I expect Choppy early on between 588-592.
For a short I would only look for it below 586.00 , I know 588 is support but this is why fib levels are important for me.
586 is fib support so unless it breaks that then you may get a bear trap dip to 587 then launch back up.. only bearish below 586!!!!!!!
tradingview.com/x/FB1JbZDO.
What I think will happen this week is a bounce back to 596 minimum and 600 max before we head lower, so unless we gap down below 586 then the move is likely to be upwards early on. If the market gaps up early Monday then wait for a pullback or fizzle out to by calls for a Tues or Wed pop higher.
I think we could see a H&S play out if price pushes back to 600

But first we need a pop, in terms of day trading you never want to open short when you see the indexes hourly RSI and Bollingerband oversold.
With the exception off thee Qqq idea .. the other trade I like is
 NVDA calls for a pop back to 190
Pullback to retest rectangle breakout here at 184.00.

I like calls above 185, target 190.
Over 190 and 194 comes but have a tight stop over 189 incase it can't go higher.
Entry
Above 185
Stop loss
Below 183.50
Target 190
Catch you all later , my apologies if I'm not too responsive or active lately; I've been busy.
In this post I tried to show you how I come up with my idea/ conviction. I use this method on every stock I chart and it actually only takes me 10mins max to chart something and come up with a Tradeable strategy.
You have to come up with a method/strategy in trading and charting, then apply this method every day.. you should be charting atleast 3 stocks a day with this method because that's the only way you will become proficient enough to make it. And staring at a chart because you are in a trade doesn't count. This trading and charting thing is more about repetitive discipline than intelligence. If you can't find 30mins a day to fine tune your charting craft then it will be difficult staying in this game
Let's start off with a bigger picture
Zooming out you can see that we've tagged our long term resistance since sept
Zooming in but staying on the weekly
You'll notice the reversal weekly bearish engulfing and also the volume..
The candle alone is is nasty, but that volume is a bad. The most volume we've seen since april rebound and it's bearish..
So with that being I think are headed back to 558 minimum. And also I think this moves happens before November 1st.
Nov to late Dec normally isn't to kind to bears and also we would be in the middle of tech earnings so I don't like to short the market during bullish Seasonality + earnings season.
So
Let me show you my steps one by one how I come up with my tech homework/trades
Step one Identify where your
Moving averages
Price action
Fib levels are
Start on daily time frame
I like to use my 20/50ma
The 20ma resistance will be 599-600
The 50ma support will be 582
Next I add the fib levels on my chart starting from all time high and going back lower to that launch pad at 558.. some people go back further and lower than 558 but those levels aren't ACTIONABLE for day trading or swinging weeklies. I need to know where proce can go for the next 3 sessions or next 3%
So fib levels confirm the moving average levels
As you can see 601 .786 fib level will match up closely with the 599 20sma Resistance
The 579 .382 will match nicely with the 50sma
When I say match , what I mean is let's say I short Qqq on a rebound at 599, I would be will to add another put all the way up to its next resistance at 601 if needed and then I could place a 20% loss behind 601.
Similar to if I was to buy calls at 582 50sma for a nice bounce, I would be willing to add more calls all the down to 579 gap close or .382 fib with a 20% stop below that..
This method of positioning gives you a back up plan and prevents paper hand trading.
Lastly let's look at just price action and trend lines..
For that we'll have to go down the hourly time frame (2hour chart)
Some people would argue upon seeing this trendline retest that it's a great buy area, and I would agree short term it may bounce but being up at the weekly trendline I think this summer uptrend gives way this week or next.
1hour chart
This is where I just look at price action and volume. I look for areas with a lot of traffic and heavy volume
.
Going into next week you can see its alot of support at 588 and I circled in green the previous volume that came into that area.
Overhead resistance will be the 200sma at 592 and support at 588.. over 593 and 596 comes but I expect Choppy early on between 588-592.
For a short I would only look for it below 586.00 , I know 588 is support but this is why fib levels are important for me.
586 is fib support so unless it breaks that then you may get a bear trap dip to 587 then launch back up.. only bearish below 586!!!!!!!
tradingview.com/x/FB1JbZDO.
What I think will happen this week is a bounce back to 596 minimum and 600 max before we head lower, so unless we gap down below 586 then the move is likely to be upwards early on. If the market gaps up early Monday then wait for a pullback or fizzle out to by calls for a Tues or Wed pop higher.
I think we could see a H&S play out if price pushes back to 600
But first we need a pop, in terms of day trading you never want to open short when you see the indexes hourly RSI and Bollingerband oversold.
With the exception off thee Qqq idea .. the other trade I like is
Pullback to retest rectangle breakout here at 184.00.
I like calls above 185, target 190.
Over 190 and 194 comes but have a tight stop over 189 incase it can't go higher.
Entry
Above 185
Stop loss
Below 183.50
Target 190
Catch you all later , my apologies if I'm not too responsive or active lately; I've been busy.
In this post I tried to show you how I come up with my idea/ conviction. I use this method on every stock I chart and it actually only takes me 10mins max to chart something and come up with a Tradeable strategy.
You have to come up with a method/strategy in trading and charting, then apply this method every day.. you should be charting atleast 3 stocks a day with this method because that's the only way you will become proficient enough to make it. And staring at a chart because you are in a trade doesn't count. This trading and charting thing is more about repetitive discipline than intelligence. If you can't find 30mins a day to fine tune your charting craft then it will be difficult staying in this game
Disclaimer
The information and publications are not meant to be, and do not constitute, financial, investment, trading, or other types of advice or recommendations supplied or endorsed by TradingView. Read more in the Terms of Use.
Disclaimer
The information and publications are not meant to be, and do not constitute, financial, investment, trading, or other types of advice or recommendations supplied or endorsed by TradingView. Read more in the Terms of Use.