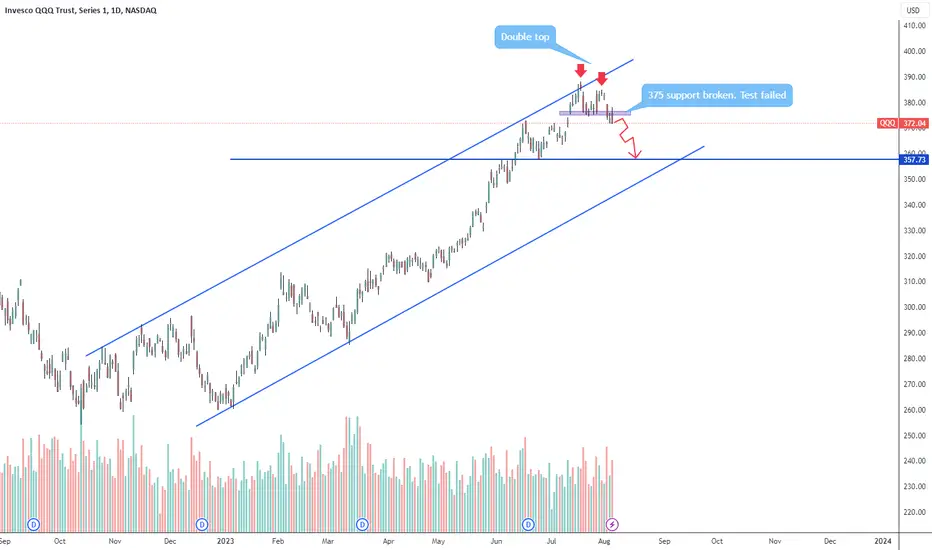
Double top confirmed in the daily timeframe. I think we are going to see a correction towards the 360 zone. I'm not trading this, I haven't had much success trading indexes, I prefer stocks. It's very possible that bulls push the price again to the $375 zone now resistance. That's the thing with indexes, sometimes looks like a free fall but suddenly buyers come out from nothing and push the price up for a day or two and puts expire. Don't tell that never happened to you. I use this to see the sentiment of the market. Yesterday I bought a bunch of puts of AAL, MRNA, AMD, CROCS and TXN, all showing strong bearish patterns. At every pull back up I will buy more.
Note
Let me revise my previous analysis. I find the chart below more accurate. We will see a final push to the downside this week. There is a lot of support at the 365 level. I think we may also see a false break down (watch out bears) and then a hard rejection off the support. In the mean time I'm closing my shorts and adding to my longs at every dip.Note
I usually don't use lower timeframes but sometimes I like to look closer. This is a 4H chart. Doji candlestick at the ascending channel support. We will see some turbulence tomorrow:Disclaimer
The information and publications are not meant to be, and do not constitute, financial, investment, trading, or other types of advice or recommendations supplied or endorsed by TradingView. Read more in the Terms of Use.
Disclaimer
The information and publications are not meant to be, and do not constitute, financial, investment, trading, or other types of advice or recommendations supplied or endorsed by TradingView. Read more in the Terms of Use.