I have been neglecting QQQ lately in favour of SPY and DIA. I just am getting sick of the huge volatility in both SPY and QQQ and leaning more towards DIA as my go to stock, but I thought I would look to see how QQQ is coming along and see if we can plot out its outlook.
So currently, QQQ is in a downtrend, obviously. The one hour chart is really messy. To some it may show that QQQ is undecided. To me, it seems like a war between the bears and the bulls. QQQ wants to go up, but it doesn't have sizeable long biased backing. And ultimately, QQQ will likely be heading down.
But let's take a look at why this is, because QQQ is at a very interesting stage in its trading life that is kind of exciting IMO. But before we get into that, let's take a brief look at the technicals.
QQQ Technicals:

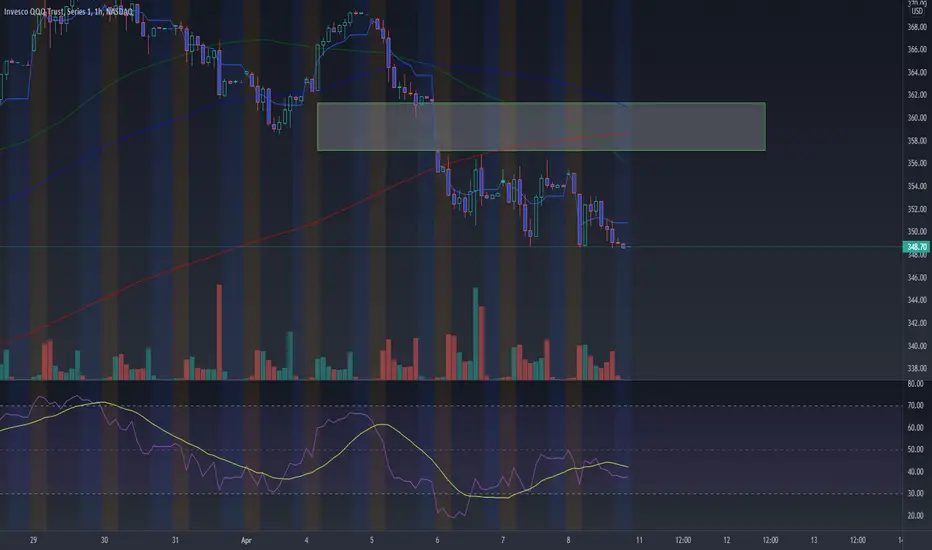
The technicals are summarized in that chart, but just to go over it, here is the summary in detail:
Below critical MAs: on the 1 hour, it is below the 50, 100 and 200 MA. I don't believe in MA fishing and comparing multiple MAs or EMAs, because eventually you will find what you are looking for and succumb to confirmation bias. Thus, on the rare occurrences I will look at MAs, it is always ONLY the 50, 100 and 200 as those are widely used and accepted.
RSI Neutral: RSI is currently neutral. There is room for movement in either direction. No conclusions can be drawn off of this.
Finding support at 348.70: QQQ is finding support at this level. This is interesting as this has been the bottom out range that my projections have calculated over the past week. So I find this very curious that it is respecting this bottom out range! I am consistently shocked at the results of these calculations when I see how they play out in real life lol.
QQQ's chart pattern is telling on the daily. The 1 hour chart is kind of messy. I have plotted the following. Please note, that I am not sure if this is a charting technique applied by many. I have used it in the past. However, I trade 95% math and 5% chart patterns so at the end of the end of the day, the patterns are generally irrelevant to me:

However, here is the telling tale, IMO:

We see here that QQQ is repeating the same pattern it has previously. This pattern is, I don't know, I call it the bird pattern but I am not sure what this is really, I just know its bearish. We see it lead to a sustained sell off previously, and now that we are repeating it, we can anticipate more to come.
The Math:
So QQQ has been making mad progress towards its reversion to the mean. To the point where its almost there!
As it stands now, we can expect to test around 341 next week. Once we hit this level, QQQ will be back within its normal trading parameters.
Now I know what you may be thinking. If you apply the linear regression tool on tradingview it still looks quite overdone. (See below an example, QQQ charted over the monthly time frame):

But the reason for that is because QQQ and most stocks are not linear in nature. They are actually more quadratic. And quadratic lines are curved and not straight. You can actually see this very clearly on QQQ's chart just by looking at the monthly:

So, what does this all mean in terms of math predictions? Well, what it means is:
1) QQQ will likely test 341 this week. Probably lower, but 341 is in the forecast.
2) Once QQQ tests the 341 range, QQQ will be trading within the parameters of a reversion to the mean. That means, we may see some consolidation and some bouncing around a bit more.
3) Generally, when stocks revert to the mean, they overshoot it a bit. So we can expect further selling off below this range. This may not happen aggressively and judging by the current market sentiment, it may slowly bleed out over the next couple of months, but it could happen aggressively. Its up in the air. But in general, I do expect this to fall below its mean by at least 5 to 10%.
I can show you an example of another stock that is quadratic and how it looks on the regression tool. That stock is SPX!

Now, as pull back happens and then stock continues, you will now that tradingviews regression tool expands in size to accommodate the fact that the stock did not retest a "linear mean". So it can be very misleading using that regression tool if you don't have a sold understanding of what exactly you are looking at. So be careful!
Anyway, that is my deep dive analysis into QQQ.
I will give you your ranges for Monday:
Trading Range: 344 - 353
Bullish Break: Over 352
Bearish Break: Under 346
That's it! Let me know your comments, questions and criticisms below!
Enjoy the rest of your weekend!!
So currently, QQQ is in a downtrend, obviously. The one hour chart is really messy. To some it may show that QQQ is undecided. To me, it seems like a war between the bears and the bulls. QQQ wants to go up, but it doesn't have sizeable long biased backing. And ultimately, QQQ will likely be heading down.
But let's take a look at why this is, because QQQ is at a very interesting stage in its trading life that is kind of exciting IMO. But before we get into that, let's take a brief look at the technicals.
QQQ Technicals:
The technicals are summarized in that chart, but just to go over it, here is the summary in detail:
Below critical MAs: on the 1 hour, it is below the 50, 100 and 200 MA. I don't believe in MA fishing and comparing multiple MAs or EMAs, because eventually you will find what you are looking for and succumb to confirmation bias. Thus, on the rare occurrences I will look at MAs, it is always ONLY the 50, 100 and 200 as those are widely used and accepted.
RSI Neutral: RSI is currently neutral. There is room for movement in either direction. No conclusions can be drawn off of this.
Finding support at 348.70: QQQ is finding support at this level. This is interesting as this has been the bottom out range that my projections have calculated over the past week. So I find this very curious that it is respecting this bottom out range! I am consistently shocked at the results of these calculations when I see how they play out in real life lol.
QQQ's chart pattern is telling on the daily. The 1 hour chart is kind of messy. I have plotted the following. Please note, that I am not sure if this is a charting technique applied by many. I have used it in the past. However, I trade 95% math and 5% chart patterns so at the end of the end of the day, the patterns are generally irrelevant to me:
However, here is the telling tale, IMO:
We see here that QQQ is repeating the same pattern it has previously. This pattern is, I don't know, I call it the bird pattern but I am not sure what this is really, I just know its bearish. We see it lead to a sustained sell off previously, and now that we are repeating it, we can anticipate more to come.
The Math:
So QQQ has been making mad progress towards its reversion to the mean. To the point where its almost there!
As it stands now, we can expect to test around 341 next week. Once we hit this level, QQQ will be back within its normal trading parameters.
Now I know what you may be thinking. If you apply the linear regression tool on tradingview it still looks quite overdone. (See below an example, QQQ charted over the monthly time frame):
But the reason for that is because QQQ and most stocks are not linear in nature. They are actually more quadratic. And quadratic lines are curved and not straight. You can actually see this very clearly on QQQ's chart just by looking at the monthly:
So, what does this all mean in terms of math predictions? Well, what it means is:
1) QQQ will likely test 341 this week. Probably lower, but 341 is in the forecast.
2) Once QQQ tests the 341 range, QQQ will be trading within the parameters of a reversion to the mean. That means, we may see some consolidation and some bouncing around a bit more.
3) Generally, when stocks revert to the mean, they overshoot it a bit. So we can expect further selling off below this range. This may not happen aggressively and judging by the current market sentiment, it may slowly bleed out over the next couple of months, but it could happen aggressively. Its up in the air. But in general, I do expect this to fall below its mean by at least 5 to 10%.
I can show you an example of another stock that is quadratic and how it looks on the regression tool. That stock is SPX!
Now, as pull back happens and then stock continues, you will now that tradingviews regression tool expands in size to accommodate the fact that the stock did not retest a "linear mean". So it can be very misleading using that regression tool if you don't have a sold understanding of what exactly you are looking at. So be careful!
Anyway, that is my deep dive analysis into QQQ.
I will give you your ranges for Monday:
Trading Range: 344 - 353
Bullish Break: Over 352
Bearish Break: Under 346
That's it! Let me know your comments, questions and criticisms below!
Enjoy the rest of your weekend!!
Note
I didn't expect to get 441 so quickly! But we got it today!SO its safe to say QQQ is now trading within its normal and predicted growth levels.
Kudos QQQ! You have successfully completed your reversion.
Now it will be interesting to see what happens next! 341 is still the top end of its mean, the range is actually 324 - 341. So QQQ can still fall down to 324 and be trading within its normal parameters.
Let us see if we can make it down to this level.
Get:
- Live Updates,
- Discord access,
- Access to my Proprietary Merlin Software,
- Access to premium indicators,
patreon.com/steversteves
Now on X!
- Live Updates,
- Discord access,
- Access to my Proprietary Merlin Software,
- Access to premium indicators,
patreon.com/steversteves
Now on X!
Disclaimer
The information and publications are not meant to be, and do not constitute, financial, investment, trading, or other types of advice or recommendations supplied or endorsed by TradingView. Read more in the Terms of Use.