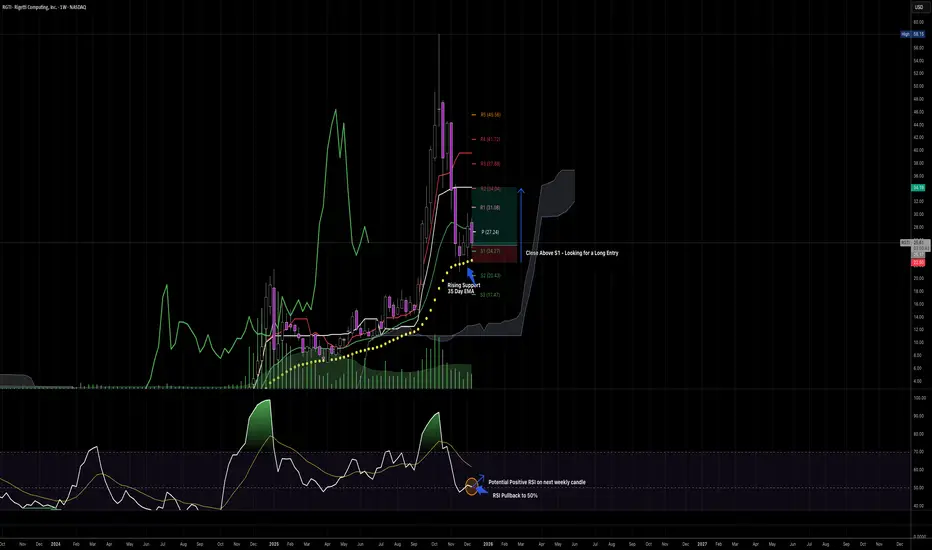
The Weekly candle has pulled back nicely into Weekly S1 Support.
In addition, a rising channel (35 EMA) of support underpins the pull-back.
The RSI has also pulled back to the 50%, which could result in a upward and positive bounce into next week, if it holds.
I am looking for a long entry on the this Weekly candle closing above S1 , with a stop below the 35 EMA.
-> Take Profit will be at R2 ($34) and the Ichi-Moku Base-Line, which is also located very close to R2.
-> Expect first resistance at the 20 Day EMA ($27) and second at R1 ($31).
Naturally monitor the trade and take some profit off if momentum fails on lower timeframe closes on the Daily and 4H charts.
This is not trading advice, do your own research. Always! :)
Disclaimer
The information and publications are not meant to be, and do not constitute, financial, investment, trading, or other types of advice or recommendations supplied or endorsed by TradingView. Read more in the Terms of Use.
Disclaimer
The information and publications are not meant to be, and do not constitute, financial, investment, trading, or other types of advice or recommendations supplied or endorsed by TradingView. Read more in the Terms of Use.