RGTI Weekly Outlook (Oct 28–31): “Quantum Pullback or Continuation? Watching $40 for the Next Big Move”
1. Weekly (1W) — Long-Term Structure
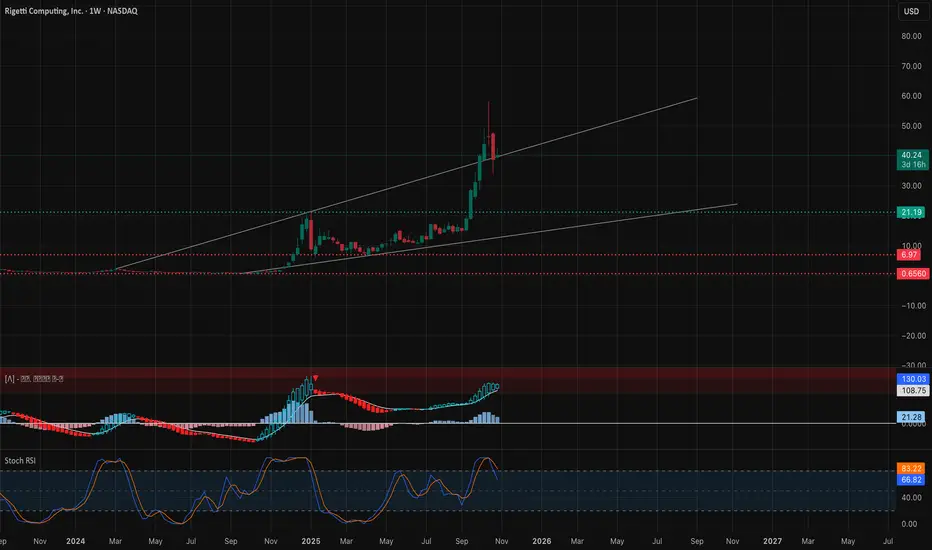
Rigetti Computing (RGTI) recently completed a massive breakout structure, with a BOS (Break of Structure) that sent price soaring from single digits into the $40 zone — a gain exceeding 500%. The stock is now undergoing its first healthy correction phase within a broad ascending channel.
* Trend Bias: Still bullish on higher timeframe.
* Support Levels: $22 → $18 → $10
* Resistance Levels: $40 → $55 → $75
* Momentum: Weekly MACD remains firmly bullish but histogram momentum is cooling — a normal retracement after parabolic expansion.
* Stoch RSI: Rotating down from overbought, showing consolidation rather than full reversal.
💡 Macro takeaway: The structure suggests continuation potential toward $55 once the pullback stabilizes. Maintaining above $18–$22 would confirm the higher low formation and keep long-term bulls in control.
2. Daily (1D) — Corrective Phase in Play

On the daily timeframe, RGTI is retracing after forming a high near $55. The latest daily candles show early stabilization as buyers defend near-term support at $38–$40, coinciding with the trendline and prior BOS zone.
* Market Structure: Still in a correction phase after a vertical breakout.
* Support Zones: $40 → $34 → $28
* Resistance Zones: $43 → $50 → $55
* Indicators:
* MACD remains bearish short-term, but histogram contraction suggests momentum loss on the downside.
* Stoch RSI showing a potential bullish cross from oversold territory.
📈 Daily insight: The base-building around $38–$40 is crucial. If bulls can reclaim $43–$45 with volume, the next leg toward $50–$55 could trigger, supported by short-covering momentum.
3. 1-Hour (1H) — Intraday Playbook

On the 1-hour chart, the price has reclaimed its short-term uptrend after a CHoCH → BOS sequence. The stock is attempting to hold above the local trendline and defend $40 as its key pivot level.
* Bias: Intraday bullish while holding above $38.
* Support: $38 → $36 → $34
* Resistance: $43 → $45 → $48
* Playbook Scenarios:
* Bullish scalp: Break above $43.50, target $45–$48 with stop under $40.
* Dip buy: Enter near $38–$39 if defended; risk below $36 for bounce back to $43.
* Bearish invalidation: Below $36 = structure break, opens $34 retest.
💬 Intraday read: Momentum on MACD is neutral but improving. A decisive push over $43 could trigger momentum ignition, aligning with the hourly ascending structure.
4. GEX & Options Sentiment
From the GEX (Gamma Exposure) data and volume structure:
* Highest Positive NETGEX / Gamma Wall: $45 → $50 zone.
* Call Walls: $43 → $50 → $55.
* Put Support: $38 → $34.
* IVR: Elevated at ~50+ (speculative sentiment strong).
* Call Sentiment: Heavily call-weighted, aligning with bullish bias post-consolidation.
🔍 Interpretation: As long as RGTI maintains above $38–$39, the gamma setup favors upside continuation. A break above $43 could ignite a push toward the $50 call wall region.
5. Suggested Option Setups
Bullish Play (Primary Bias):
* Play: 40C–45C (0–2DTE) breakout setup.
* Entry: Above $43 breakout confirmation.
* Targets: $45 → $48 → $50.
* Stop: Below $39.
Dip Buy Setup:
* Play: 40C (1DTE) near $38–$39 support bounce.
* Target: $43–$45.
* Stop: Below $36.
Bearish Hedge (only if breakdown):
* Play: 35P (1DTE) if price loses $36 structure.
* Target: $34 → $30.
* Stop: Above $39.
Directional Bias
RGTI remains a high-beta quantum computing momentum stock with strong institutional attention. While short-term cooling is evident, the structure still supports continuation once the $43–$45 zone breaks.
🎯 Primary Bias: Bullish continuation after correction. ⚠️ Invalidation: Breakdown below $36 → deeper retracement toward $30–$34 range.
This analysis is for educational purposes only and does not constitute financial advice. Always do your own research and manage risk before trading.
1. Weekly (1W) — Long-Term Structure
Rigetti Computing (RGTI) recently completed a massive breakout structure, with a BOS (Break of Structure) that sent price soaring from single digits into the $40 zone — a gain exceeding 500%. The stock is now undergoing its first healthy correction phase within a broad ascending channel.
* Trend Bias: Still bullish on higher timeframe.
* Support Levels: $22 → $18 → $10
* Resistance Levels: $40 → $55 → $75
* Momentum: Weekly MACD remains firmly bullish but histogram momentum is cooling — a normal retracement after parabolic expansion.
* Stoch RSI: Rotating down from overbought, showing consolidation rather than full reversal.
💡 Macro takeaway: The structure suggests continuation potential toward $55 once the pullback stabilizes. Maintaining above $18–$22 would confirm the higher low formation and keep long-term bulls in control.
2. Daily (1D) — Corrective Phase in Play
On the daily timeframe, RGTI is retracing after forming a high near $55. The latest daily candles show early stabilization as buyers defend near-term support at $38–$40, coinciding with the trendline and prior BOS zone.
* Market Structure: Still in a correction phase after a vertical breakout.
* Support Zones: $40 → $34 → $28
* Resistance Zones: $43 → $50 → $55
* Indicators:
* MACD remains bearish short-term, but histogram contraction suggests momentum loss on the downside.
* Stoch RSI showing a potential bullish cross from oversold territory.
📈 Daily insight: The base-building around $38–$40 is crucial. If bulls can reclaim $43–$45 with volume, the next leg toward $50–$55 could trigger, supported by short-covering momentum.
3. 1-Hour (1H) — Intraday Playbook
On the 1-hour chart, the price has reclaimed its short-term uptrend after a CHoCH → BOS sequence. The stock is attempting to hold above the local trendline and defend $40 as its key pivot level.
* Bias: Intraday bullish while holding above $38.
* Support: $38 → $36 → $34
* Resistance: $43 → $45 → $48
* Playbook Scenarios:
* Bullish scalp: Break above $43.50, target $45–$48 with stop under $40.
* Dip buy: Enter near $38–$39 if defended; risk below $36 for bounce back to $43.
* Bearish invalidation: Below $36 = structure break, opens $34 retest.
💬 Intraday read: Momentum on MACD is neutral but improving. A decisive push over $43 could trigger momentum ignition, aligning with the hourly ascending structure.
4. GEX & Options Sentiment
From the GEX (Gamma Exposure) data and volume structure:
* Highest Positive NETGEX / Gamma Wall: $45 → $50 zone.
* Call Walls: $43 → $50 → $55.
* Put Support: $38 → $34.
* IVR: Elevated at ~50+ (speculative sentiment strong).
* Call Sentiment: Heavily call-weighted, aligning with bullish bias post-consolidation.
🔍 Interpretation: As long as RGTI maintains above $38–$39, the gamma setup favors upside continuation. A break above $43 could ignite a push toward the $50 call wall region.
5. Suggested Option Setups
Bullish Play (Primary Bias):
* Play: 40C–45C (0–2DTE) breakout setup.
* Entry: Above $43 breakout confirmation.
* Targets: $45 → $48 → $50.
* Stop: Below $39.
Dip Buy Setup:
* Play: 40C (1DTE) near $38–$39 support bounce.
* Target: $43–$45.
* Stop: Below $36.
Bearish Hedge (only if breakdown):
* Play: 35P (1DTE) if price loses $36 structure.
* Target: $34 → $30.
* Stop: Above $39.
Directional Bias
RGTI remains a high-beta quantum computing momentum stock with strong institutional attention. While short-term cooling is evident, the structure still supports continuation once the $43–$45 zone breaks.
🎯 Primary Bias: Bullish continuation after correction. ⚠️ Invalidation: Breakdown below $36 → deeper retracement toward $30–$34 range.
This analysis is for educational purposes only and does not constitute financial advice. Always do your own research and manage risk before trading.
Disclaimer
The information and publications are not meant to be, and do not constitute, financial, investment, trading, or other types of advice or recommendations supplied or endorsed by TradingView. Read more in the Terms of Use.
Disclaimer
The information and publications are not meant to be, and do not constitute, financial, investment, trading, or other types of advice or recommendations supplied or endorsed by TradingView. Read more in the Terms of Use.