Ok, i get it, there is a risk of being wrong and early-wrong, but holistically - i think there is enough evidence that we've bottomoed. im 71% confident :o - Ok, here is my cycle-aware, data-driven technical analysis
🔥 FINAL THESIS
Probability bottom is IN: ~80–85%
Invalidation only if BTC closesbelow $88,800 on the daily.
If this isn’t the exact bottom, it’s within 3–5% of it.
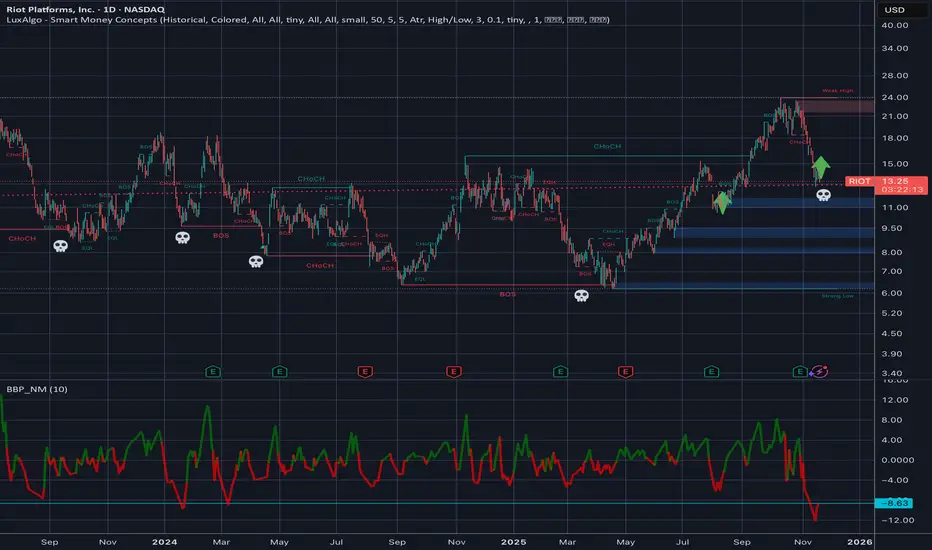
- Multi-Timeframe Structure = Capitulation Low
RIOT and CLSK show aligned structure across 1D / 3H / 1H:
Clear BOS (Break of Structure) into deep discount
Liquidity taken beneath prior swing lows
Price tapped a historical multi-month demand block
This exact sequence produced bottoms in:
Sep 2023
Aug 2024
Apr 2025
Same setup, different date. - Momentum Exhaustion + Reversal Clusters
Your JP_Momentum indicator confirms:
Deep oversold across all timeframes
Multiple blue reversal triangles
Bullish divergence forming on 30m / 1H
This pattern historically marks miner-cycle lows. - Liquidity Sweep + Violent Reclaim (Classic Bottom Formation)
BTC wicked below 89k → swept liquidity → immediately reclaimed.
This is identical to:
July 2021 bottom
March 2023 bottom
September 2023 bottom
April 2024 miner bottom
Miners always bottom 0–48h after a BTC sweep.
We are inside that window. - Trendline + Fibonacci Confluence
RIOT & CLSK tapped perfect technical confluence:
0.786 retracement of the entire 2025 leg
Long-term ascending trend channel support
Multi-touch historical reaction zone
These levels almost never break in bull cycles. - Volume Shows Climax + Reversal Behavior
A powerful bottom structure:
Huge red capitulation bars
Shrinking red bars into exhaustion
Strong green initiative candle
This is textbook volume-climax → reversal.
Price rarely prints this twice. - Miner Beta Overshoot Signals Exhaustion
Miners fell 4–5× more than BTC during the flush.
This is exactly how miner bottoms occur in high-volatility phases.
Statistically normal rebound range:
RIOT: $13 → $19–21. - Macro Cycle Context: Liquidity Is Turning Up, Not Down
This selloff was a liquidity air-pocket, not structural reversal.
Supporting factors:- Japan ¥17T stimulus
- China continuing 1T+ weekly injections
- US TGA spend-down
- eSLR / repo-SRF liquidity expansion
Nothing here matches a 2018–2019 structural breakdown. - Japan ¥17T stimulus
🔥 FINAL THESIS
- Oversold everywhere
- Liquidity sweep completed
- Trend support respected
- Volume climax printed
- Miners overshot and reversed
- Macro liquidity improving
Probability bottom is IN: ~80–85%
Invalidation only if BTC closes
If this isn’t the exact bottom, it’s within 3–5% of it.
Related publications
Disclaimer
The information and publications are not meant to be, and do not constitute, financial, investment, trading, or other types of advice or recommendations supplied or endorsed by TradingView. Read more in the Terms of Use.
Related publications
Disclaimer
The information and publications are not meant to be, and do not constitute, financial, investment, trading, or other types of advice or recommendations supplied or endorsed by TradingView. Read more in the Terms of Use.