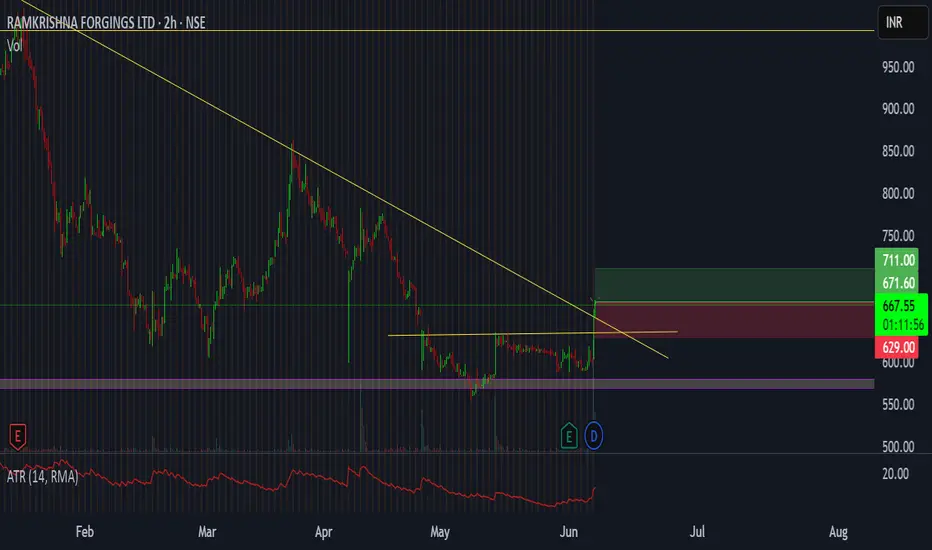
The area around 575 is a strong support on daily and weekly chart (long term support),
In the last four months, the stock has bounced off from around this level with a rise in volume,
every time higher than the previous,
A triangular pattern is also visible , having formed during this period, and now a small rectangular pattern is also visible,
A breakout through all of these has occurred today
Thus, for a short term trade,
tgt 711, sl 629
Trade closed: stop reached
Disclaimer
The information and publications are not meant to be, and do not constitute, financial, investment, trading, or other types of advice or recommendations supplied or endorsed by TradingView. Read more in the Terms of Use.
Disclaimer
The information and publications are not meant to be, and do not constitute, financial, investment, trading, or other types of advice or recommendations supplied or endorsed by TradingView. Read more in the Terms of Use.