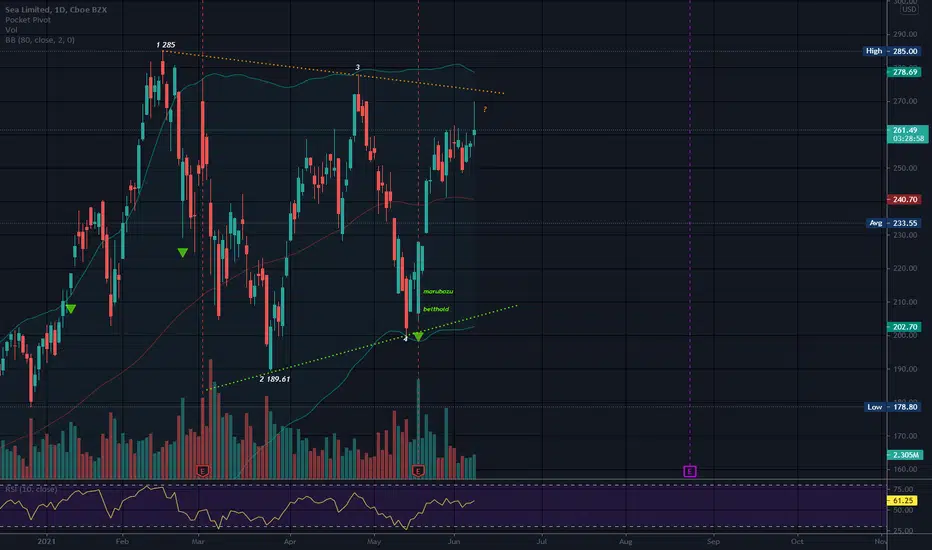
SE appears to be trading in a triangle. This is a neutral pattern until a trendline is broken with a trend in that direction.
It is not a tight triangle, as there is a lot of space that is not filled with price/candles. It has not reached the top trendline as of yet. The top is resistance until broken and the bottom is support unless broken.
No recommendation
It is not a tight triangle, as there is a lot of space that is not filled with price/candles. It has not reached the top trendline as of yet. The top is resistance until broken and the bottom is support unless broken.
No recommendation
Note
Do not forget to look behind you and always go your own wayNote
not a good wick (;Disclaimer
The information and publications are not meant to be, and do not constitute, financial, investment, trading, or other types of advice or recommendations supplied or endorsed by TradingView. Read more in the Terms of Use.
Disclaimer
The information and publications are not meant to be, and do not constitute, financial, investment, trading, or other types of advice or recommendations supplied or endorsed by TradingView. Read more in the Terms of Use.