🔎 Market Structure Analysis
4H Chart (Swing Context)
Price is respecting the ascending channel, but currently stalling inside the 81,500–81,700 supply zone.
Prior impulsive leg broke above 81,200 (former resistance, now turned demand zone).
Bias: Short-term bullish, but entering a resistance-heavy zone.
1H Chart (Intraday Context)
Structure: Clear series of higher highs & higher lows → bullish market structure.
81,200 level has multiple rejections in the past → key support now.
Current candles are consolidating inside the red supply zone (81,500–81,700) → indecision.
BOS (Break of Structure) confirms buyers’ dominance, but upside liquidity is thinning.
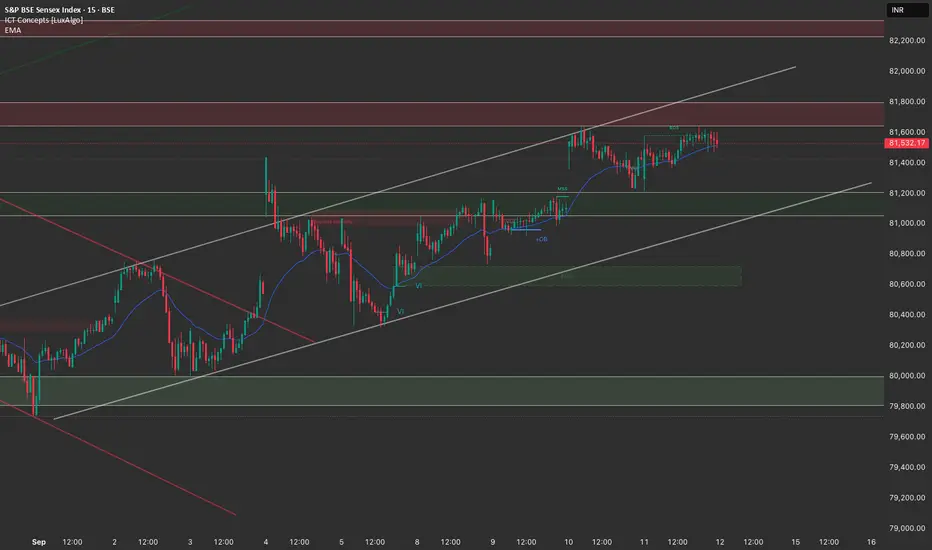
15m Chart (Execution View)
Sideways consolidation just below 81,600 supply.
Order block around 81,200–81,250 acting as a buffer for downside liquidity.
Small FVGs (Fair Value Gaps) in 81,300–81,350 zone may act as intraday support zones.
📝 Trade Plan (12th Sept)
Bullish Scenario
✅ Buy on retracement near 81,200–81,250 demand zone (OB + structure support).
Targets:
TP1: 81,500 (intraday liquidity)
TP2: 81,700–81,750 (supply zone top & channel resistance)
Stop Loss: below 81,000 (channel bottom & invalidation).
Bearish Scenario
❌ Short only if price rejects 81,600–81,700 zone with strong bearish engulfing.
Targets:
TP1: 81,300 (gap fill)
TP2: 81,200 (major demand zone)
Stop Loss: above 81,750.
🎯 Bias
Neutral-to-bullish → Expect pullback to 81,200 before another push higher.
Caution: If 81,200 fails, downside acceleration towards 80,800–80,600 could unfold.
4H Chart (Swing Context)
Price is respecting the ascending channel, but currently stalling inside the 81,500–81,700 supply zone.
Prior impulsive leg broke above 81,200 (former resistance, now turned demand zone).
Bias: Short-term bullish, but entering a resistance-heavy zone.
1H Chart (Intraday Context)
Structure: Clear series of higher highs & higher lows → bullish market structure.
81,200 level has multiple rejections in the past → key support now.
Current candles are consolidating inside the red supply zone (81,500–81,700) → indecision.
BOS (Break of Structure) confirms buyers’ dominance, but upside liquidity is thinning.
15m Chart (Execution View)
Sideways consolidation just below 81,600 supply.
Order block around 81,200–81,250 acting as a buffer for downside liquidity.
Small FVGs (Fair Value Gaps) in 81,300–81,350 zone may act as intraday support zones.
📝 Trade Plan (12th Sept)
Bullish Scenario
✅ Buy on retracement near 81,200–81,250 demand zone (OB + structure support).
Targets:
TP1: 81,500 (intraday liquidity)
TP2: 81,700–81,750 (supply zone top & channel resistance)
Stop Loss: below 81,000 (channel bottom & invalidation).
Bearish Scenario
❌ Short only if price rejects 81,600–81,700 zone with strong bearish engulfing.
Targets:
TP1: 81,300 (gap fill)
TP2: 81,200 (major demand zone)
Stop Loss: above 81,750.
🎯 Bias
Neutral-to-bullish → Expect pullback to 81,200 before another push higher.
Caution: If 81,200 fails, downside acceleration towards 80,800–80,600 could unfold.
Disclaimer
The information and publications are not meant to be, and do not constitute, financial, investment, trading, or other types of advice or recommendations supplied or endorsed by TradingView. Read more in the Terms of Use.
Disclaimer
The information and publications are not meant to be, and do not constitute, financial, investment, trading, or other types of advice or recommendations supplied or endorsed by TradingView. Read more in the Terms of Use.