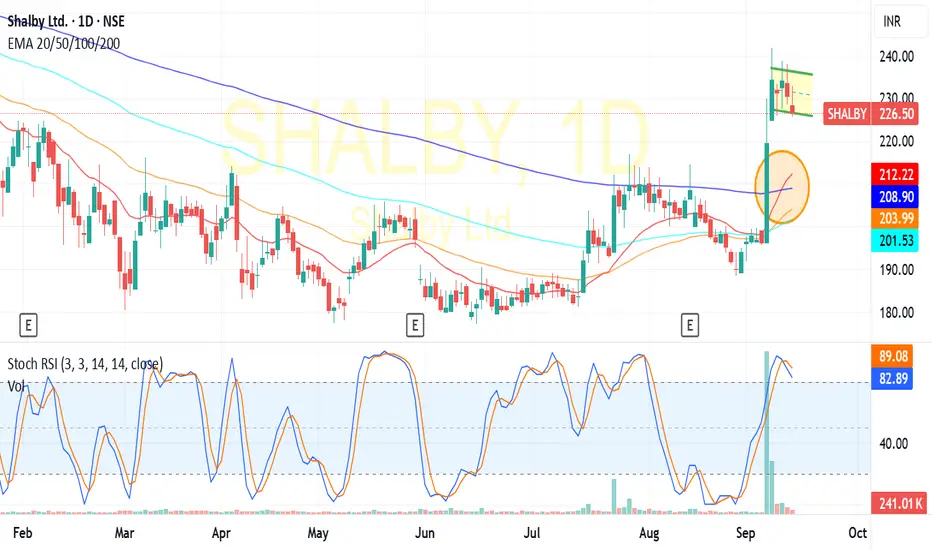
Shalby ltd:Trading at 226.50 now seems to be a value pick a this level.after a reasonable correction now trading above its 20/50/100/200 DEMA Averges in daily chart ia a clear indication of trend reversal.Shalby also formed a FLAG PATTERN in daily chart and its neck line resistance stands at 235-240,Trading above its neckline resistance see a move towards 270-300
Trade active
TARGET 1 DONE:225-247 in a weeks time of recommendations enjoy the profitsDisclaimer
The information and publications are not meant to be, and do not constitute, financial, investment, trading, or other types of advice or recommendations supplied or endorsed by TradingView. Read more in the Terms of Use.
Disclaimer
The information and publications are not meant to be, and do not constitute, financial, investment, trading, or other types of advice or recommendations supplied or endorsed by TradingView. Read more in the Terms of Use.