SLR
SLR - weekly chart shows 1) RSI breakout ... 2) trendline break
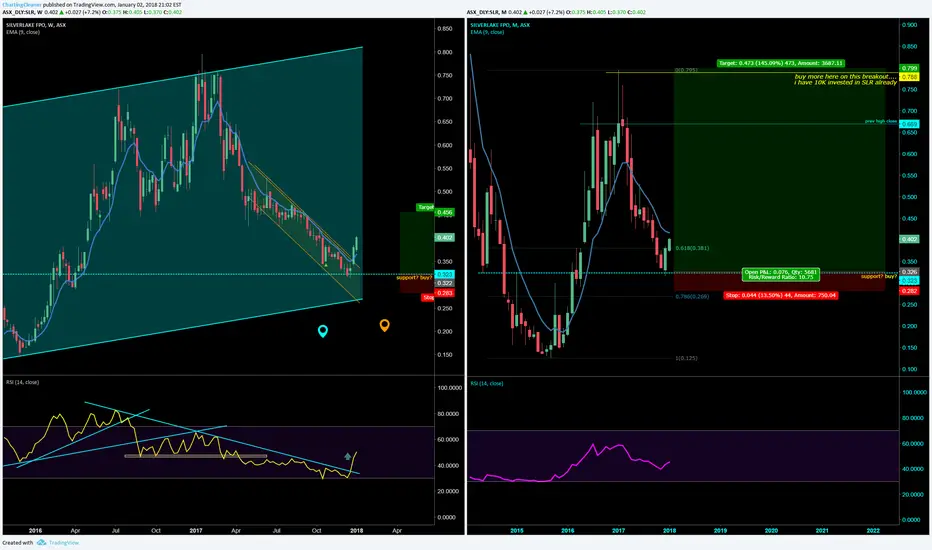
month chart shows BULLISH.. engulfing candlestick pattern ((reversal)
but month price candles are still below EMA line But at this moment some support buying has come in
to stop the price from falling.. it may have found a bottom... now lets see if the momentum can shift towards buyers... to attract more buyers.
I am IronBuddha
Disclaimer
The information and publications are not meant to be, and do not constitute, financial, investment, trading, or other types of advice or recommendations supplied or endorsed by TradingView. Read more in the Terms of Use.
I am IronBuddha
Disclaimer
The information and publications are not meant to be, and do not constitute, financial, investment, trading, or other types of advice or recommendations supplied or endorsed by TradingView. Read more in the Terms of Use.