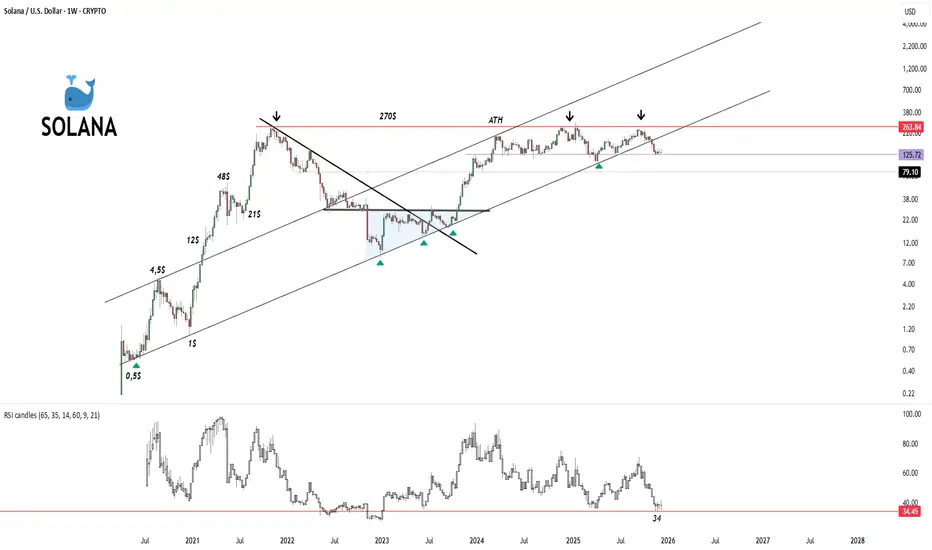
1. Macro Trend: Ascending Channel
The most dominant feature of this chart is the massive ascending parallel channel (the two long black lines sloping upwards).
Long-Term Bullish: Despite volatility, the price has generally trended upward over the last several years, respecting the boundaries of this channel.
Current Status: The price is currently in the lower half of this channel. After being rejected near the top of the channel (around the ATH region), it is retracing downward.
2. Key Support & Resistance Levels
Resistance (The Ceiling):
~$263 - $270 (Red Zone): This is the major historical resistance area, aligned with the All-Time High (ATH). The chart shows three distinct rejections (marked by black downward arrows) in this area over the last year, indicating strong selling pressure whenever SOL approaches this price.
Upper Channel Line: The diagonal upper line acts as dynamic resistance.
Support (The Floor):
~$125.72 (Purple Line): The price is currently trading at $131.50, just above this crucial horizontal support level. This level previously acted as resistance during the recovery phase; holding this line is critical for bulls.
~$79.10 (Dotted Line): If the $125 level fails, the next major historical support is around $79.
Lower Channel Line: The diagonal bottom line is the "trend defender." Every time the price has touched this line (marked by green triangles), it has bounced significantly.
3. Indicator Analysis: RSI (Relative Strength Index)
The bottom panel shows the RSI, which measures momentum.
Approaching Oversold: The RSI is currently at 34.45.
Historical Bounce Zone: The red horizontal line at 34.45 on the RSI panel suggests this is a historical "floor" for momentum. In previous instances (like late 2020 and mid-2022), when the RSI hit this low, the price eventually found a bottom and reversed upward.
Divergence: The RSI is making lower lows, confirming the strength of the current downtrend, but it is reaching a point where sellers often become exhausted.
4. Chart Patterns & Behavior
Rejection at ATH: The "Double Top" or "Triple Top" formation near the $260-$270 level is a bearish reversal pattern, which explains the significant correction SOL is currently experiencing.
Correction Phase: Since hitting the top of the channel, the price has been in a consistent downtrend (lower highs and lower lows on the weekly timeframe).
Summary
The chart depicts a critical decision point for Solana.
The Bearish Case: If the price breaks below the $125 support, it could flush down to the $80 region or the bottom of the channel to find liquidity.
The Bullish Case: The RSI hitting historical support (34) combined with the horizontal price support at $125 suggests a potential bounce area. If buyers step in here, the trend remains intact
-------------------
1. Historical "Bottom" Zone (Momentum Support)
Looking at the bottom RSI panel, whenever the RSI line touches or approaches the 34 level (the red horizontal line), we see that selling pressure tends to exhaust and buyers step in.
Past Examples: Looking at the left side of the chart (late 2020 - early 2021), when the RSI dropped to these low levels, the Solana price found a bottom (around $1) and subsequently launched a massive bullish trend.
Meaning: This level acts as a psychological floor where "bear" (seller) strength runs out and "bulls" (buyers) prepare to take over momentum.
2. Approaching Oversold Signal
RSI typically considers anything below 30 as "oversold." The 34 level is very close to this zone.
The fact that the RSI is currently at 34.45 indicates that the price has dropped sharply and quickly, and this decline is approaching an unsustainable point.
Technically, this is interpreted as a zone where it is "too late to sell, but time to look for buying opportunities."
3. Confluence of Price and RSI
The price is trading at $131.50, trying to hold the $125 support.
The fact that the RSI has hit the 34 support at this exact same moment creates a condition of "Double Support" (support in both price and momentum).
This alignment increases the probability of a reaction bounce from this area.
4. Risk Warning
While the RSI 34 level is strong support, if this level is broken to the downside (meaning RSI slides below 30 into the 20s), it indicates that the downtrend is extremely strong and panic is continuing. In this scenario, there is a risk of the price retracing to the next major support zone around $79.
In Summary: The 34 RSI level is currently a "Make or Break" decision point for Solana. Historical data suggests that this level usually marks a reversal point.
+
SOL/BTC 1w
SOL Dominance
Disclaimer
The information and publications are not meant to be, and do not constitute, financial, investment, trading, or other types of advice or recommendations supplied or endorsed by TradingView. Read more in the Terms of Use.
Disclaimer
The information and publications are not meant to be, and do not constitute, financial, investment, trading, or other types of advice or recommendations supplied or endorsed by TradingView. Read more in the Terms of Use.