This week’s review covers major altcoins and selected mid/low-cap tokens (see separate update for BTC and ETH). Focus is on macro structures, key support/resistance zones, and expected mid-term scenarios through Autumn.

 BNBUSDT
Pulled back to the local support highlighted earlier this week. I would prefer to see a more prolonged consolidation before the next higher low forms and one more break-out into the macro resistance zone at 930–1000. However, a sustained break above Thursday’s high would increase the odds of more immediate upside momentum, potentially bypassing the longer consolidation phase.
Chart:
 XRPUSDT
Is following the corrective structure outlined in the previous weekly report. A double bottom formation is possible at current levels, but as long as price remains below the 50DMA, the odds favor further downside into the macro support zone at 2.52–2.35 before a higher low can be established.
Chart:
 HYPEHUSD
Is following the price structure outlined in the previous weekly report, holding the mid-term support zone and reversing to the upside. A quick shake-out below recent August lows is possible in the coming weeks, but the next break above 50 has high odds of follow-through toward the next resistance around 65+. The price action remains among the strongest in the crypto space, suggesting potential outperformance versus most other coins during the next upside phase.
Chart: BINANCE:SOLUSDT
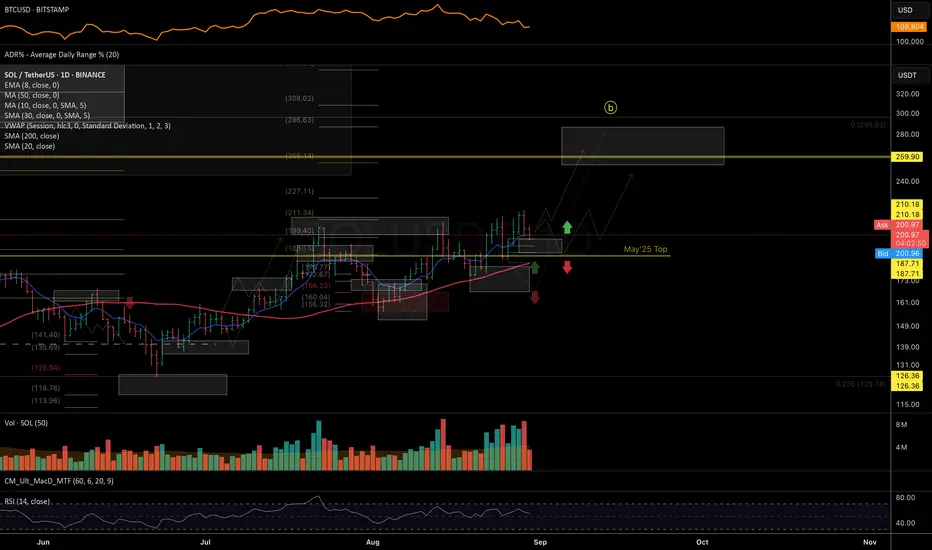
Is following the trend structure outlined in the previous crypto market review: holding mid-term support and continuing its upside momentum. The near-term trend looks bullish, supported by a high-level constructive consolidation. Given seasonality, a more prolonged autumn consolidation with a series of higher lows would be constructive for a more sustainable breakout later toward year-end.
Chart: https://www.tradingview.com/x/fPiJHVJ6/
BINANCE:LINKUSDT
Is following the trend structure suggested in previous August updates. I expect a more prolonged Autumn consolidation and base building within the higher levels of macro support: 19.5–17.5, before the next upside leg. The macro trend structure remains bullish and has a wide margin of safety, indicating potential outperformance during the next upward momentum.
Chart: https://www.tradingview.com/x/gPVbgA1c/
BINANCE:LTCUSDT
Price respected the mid-term resistance levels outlined in the previous August update. Mid-term support for the impulsive structure is 114–105. If these levels fail to hold, or if price cannot break above the Aug 24 highs, a more prolonged consolidation within the 108–95 macro support zone is likely.
Chart: https://www.tradingview.com/x/I27JVUC4/
BINANCE:SUIUSDT
Price respected the mid-term resistance levels outlined in the previous August update and is now consolidating orderly within the mid-term support zone. Expecting a higher low to form within 3.10–2.75, continuing base formation before a potential larger-degree breakout.
Chart: https://www.tradingview.com/x/5rzHgtcy/
BYBIT:ONDOUSDT
Is showing potential for a double bottom formation in the coming sessions. However, if price fails to break above 1–1.05 on any recovery attempt, the risk of a deeper correction toward macro support at 0.80–0.75 increases.
Chart: https://www.tradingview.com/x/APrPI286/
CRYPTO:TONUSD price continues to respect the mid-term support zone at 3.25–3.00, in line with the structure outlined in the Aug 9 weekly review. As long as 3.00 holds (with potential max downside extension toward 2.82), the bias remains for a higher-low formation and eventual resumption of the broader uptrend.
Chart: https://www.tradingview.com/x/FjvPijVH/
BINANCE:RENDERUSDT
Price is consolidating within the mid-term support zone at 3.50–3.25. The macro structure remains bullish, but there is still a risk of further downside toward the 3–2.75 macro support if price fails to reclaim the 50DMA on any recovery attempt.
Chart: https://www.tradingview.com/x/lmxNPlgJ/
BINANCE:UNIUSDT is following the larger-degree structure outlined in the previous August update. Key mid-term support for the impulsive structure lies at 9.70–8.80. If price fails to close above the August 22 highs or breaks below 8.80, the odds increase for a more complex corrective structure and extended consolidation.
Chart: https://www.tradingview.com/x/YUXcqOsE/
BINANCE:DOGEUSDT
0.22–0.20 marks a key mid-term support zone where price could form a higher low before continuing upside momentum. Failure to reclaim August highs on any breakout attempt may lead to continued selling pressure toward macro support below early August lows.
Chart: https://www.tradingview.com/x/oDApJyg3/
BINANCE:TAOUSDT is evolving within a complex corrective structure. Key macro support levels are at 287–270–250. Any short-term bounce that fails to close above the 50DMA may face renewed selling pressure toward the macro support zone.
Chart: https://www.tradingview.com/x/fqRUPVtH/
BINANCE:FETUSDT
Was unable to close above the local resistance zone highlighted in the previous August update and continues showing downside potential. Price may attempt to form a double bottom with early August lows, followed by a bounce toward the declining 50DMA. Macro support remains at 0.50–0.45. The weekly structure stays bullish for the long term, as long as price holds above April lows.
Daily chart: https://www.tradingview.com/x/l849MCzo/
Weekly chart: https://www.tradingview.com/x/2Wa2Z8E6/
BINANCE:VIRTUALUSDT.P
Is trading within the macro support zone 1.30–0.95–0.80, following the larger-degree corrective structure first suggested in July. I am looking for price to start forming a higher low within this range.
Chart: https://www.tradingview.com/x/GxP1nPMn/
BYBIT:POPCATUSDT is forming a complex corrective structure. Key macro support for a potential larger-degree higher low sits at 0.23–0.19.
Chart: https://www.tradingview.com/x/xYLe5rr2/
$1000FLOKIUSDT key support zone to maintain macro bullish structure stands at 0.097–0.085–0.075. Holding above these levels keeps odds in favor of long-term upside continuation.
Chart: https://www.tradingview.com/x/wYbYqFQe/
BINANCE:SUPERUSDT is approaching the mid-term support area at 0.53–0.50. This zone may provide conditions for a higher-low formation and potential trend continuation.
Chart: https://www.tradingview.com/x/YhW2JN1q/
$1000000MOGUSDT.P corrective structure remains complex, but as long as price holds within the mid-term support zone at 0.89–0.77–0.70, the odds favor a potential upside reversal with a new base formation developing.
Chart: https://www.tradingview.com/x/womrci7o/
CRYPTO:BRETT2USD is consolidating within the mid-term support zone highlighted since the Aug 9 weekly review. Watching for a higher-low formation inside 0.044–0.038 support before potential trend continuation.
Chart: https://www.tradingview.com/x/leHTkul8/
BINANCE:BONKUSDT price is in a mid-term support zone where a higher low formation could develop, setting up at least a bounce. A break below 0.0000183 would open the door to the next support levels at 0.0000165–0.0000145.
Chart: https://www.tradingview.com/x/i3IUC4ym/
Pulled back to the local support highlighted earlier this week. I would prefer to see a more prolonged consolidation before the next higher low forms and one more break-out into the macro resistance zone at 930–1000. However, a sustained break above Thursday’s high would increase the odds of more immediate upside momentum, potentially bypassing the longer consolidation phase.
Chart:
Is following the corrective structure outlined in the previous weekly report. A double bottom formation is possible at current levels, but as long as price remains below the 50DMA, the odds favor further downside into the macro support zone at 2.52–2.35 before a higher low can be established.
Chart:
Is following the price structure outlined in the previous weekly report, holding the mid-term support zone and reversing to the upside. A quick shake-out below recent August lows is possible in the coming weeks, but the next break above 50 has high odds of follow-through toward the next resistance around 65+. The price action remains among the strongest in the crypto space, suggesting potential outperformance versus most other coins during the next upside phase.
Chart:
Is following the trend structure outlined in the previous crypto market review: holding mid-term support and continuing its upside momentum. The near-term trend looks bullish, supported by a high-level constructive consolidation. Given seasonality, a more prolonged autumn consolidation with a series of higher lows would be constructive for a more sustainable breakout later toward year-end.
Chart: https://www.tradingview.com/x/fPiJHVJ6/
BINANCE:LINKUSDT
Is following the trend structure suggested in previous August updates. I expect a more prolonged Autumn consolidation and base building within the higher levels of macro support: 19.5–17.5, before the next upside leg. The macro trend structure remains bullish and has a wide margin of safety, indicating potential outperformance during the next upward momentum.
Chart: https://www.tradingview.com/x/gPVbgA1c/
BINANCE:LTCUSDT
Price respected the mid-term resistance levels outlined in the previous August update. Mid-term support for the impulsive structure is 114–105. If these levels fail to hold, or if price cannot break above the Aug 24 highs, a more prolonged consolidation within the 108–95 macro support zone is likely.
Chart: https://www.tradingview.com/x/I27JVUC4/
BINANCE:SUIUSDT
Price respected the mid-term resistance levels outlined in the previous August update and is now consolidating orderly within the mid-term support zone. Expecting a higher low to form within 3.10–2.75, continuing base formation before a potential larger-degree breakout.
Chart: https://www.tradingview.com/x/5rzHgtcy/
BYBIT:ONDOUSDT
Is showing potential for a double bottom formation in the coming sessions. However, if price fails to break above 1–1.05 on any recovery attempt, the risk of a deeper correction toward macro support at 0.80–0.75 increases.
Chart: https://www.tradingview.com/x/APrPI286/
CRYPTO:TONUSD price continues to respect the mid-term support zone at 3.25–3.00, in line with the structure outlined in the Aug 9 weekly review. As long as 3.00 holds (with potential max downside extension toward 2.82), the bias remains for a higher-low formation and eventual resumption of the broader uptrend.
Chart: https://www.tradingview.com/x/FjvPijVH/
BINANCE:RENDERUSDT
Price is consolidating within the mid-term support zone at 3.50–3.25. The macro structure remains bullish, but there is still a risk of further downside toward the 3–2.75 macro support if price fails to reclaim the 50DMA on any recovery attempt.
Chart: https://www.tradingview.com/x/lmxNPlgJ/
BINANCE:UNIUSDT is following the larger-degree structure outlined in the previous August update. Key mid-term support for the impulsive structure lies at 9.70–8.80. If price fails to close above the August 22 highs or breaks below 8.80, the odds increase for a more complex corrective structure and extended consolidation.
Chart: https://www.tradingview.com/x/YUXcqOsE/
BINANCE:DOGEUSDT
0.22–0.20 marks a key mid-term support zone where price could form a higher low before continuing upside momentum. Failure to reclaim August highs on any breakout attempt may lead to continued selling pressure toward macro support below early August lows.
Chart: https://www.tradingview.com/x/oDApJyg3/
BINANCE:TAOUSDT is evolving within a complex corrective structure. Key macro support levels are at 287–270–250. Any short-term bounce that fails to close above the 50DMA may face renewed selling pressure toward the macro support zone.
Chart: https://www.tradingview.com/x/fqRUPVtH/
BINANCE:FETUSDT
Was unable to close above the local resistance zone highlighted in the previous August update and continues showing downside potential. Price may attempt to form a double bottom with early August lows, followed by a bounce toward the declining 50DMA. Macro support remains at 0.50–0.45. The weekly structure stays bullish for the long term, as long as price holds above April lows.
Daily chart: https://www.tradingview.com/x/l849MCzo/
Weekly chart: https://www.tradingview.com/x/2Wa2Z8E6/
BINANCE:VIRTUALUSDT.P
Is trading within the macro support zone 1.30–0.95–0.80, following the larger-degree corrective structure first suggested in July. I am looking for price to start forming a higher low within this range.
Chart: https://www.tradingview.com/x/GxP1nPMn/
BYBIT:POPCATUSDT is forming a complex corrective structure. Key macro support for a potential larger-degree higher low sits at 0.23–0.19.
Chart: https://www.tradingview.com/x/xYLe5rr2/
$1000FLOKIUSDT key support zone to maintain macro bullish structure stands at 0.097–0.085–0.075. Holding above these levels keeps odds in favor of long-term upside continuation.
Chart: https://www.tradingview.com/x/wYbYqFQe/
BINANCE:SUPERUSDT is approaching the mid-term support area at 0.53–0.50. This zone may provide conditions for a higher-low formation and potential trend continuation.
Chart: https://www.tradingview.com/x/YhW2JN1q/
$1000000MOGUSDT.P corrective structure remains complex, but as long as price holds within the mid-term support zone at 0.89–0.77–0.70, the odds favor a potential upside reversal with a new base formation developing.
Chart: https://www.tradingview.com/x/womrci7o/
CRYPTO:BRETT2USD is consolidating within the mid-term support zone highlighted since the Aug 9 weekly review. Watching for a higher-low formation inside 0.044–0.038 support before potential trend continuation.
Chart: https://www.tradingview.com/x/leHTkul8/
BINANCE:BONKUSDT price is in a mid-term support zone where a higher low formation could develop, setting up at least a bounce. A break below 0.0000183 would open the door to the next support levels at 0.0000165–0.0000145.
Chart: https://www.tradingview.com/x/i3IUC4ym/
Trade active
Charts were not posted correctly: Is following the trend structure outlined in the previous crypto market review: holding mid-term support and continuing its upside momentum. The near-term trend looks bullish, supported by a high-level constructive consolidation. Given seasonality, a more prolonged autumn consolidation with a series of higher lows would be constructive for a more sustainable breakout later toward year-end.
Chart:
Is following the trend structure suggested in previous August updates. I expect a more prolonged Autumn consolidation and base building within the higher levels of macro support: 19.5–17.5, before the next upside leg. The macro trend structure remains bullish and has a wide margin of safety, indicating potential outperformance during the next upward momentum.
Chart:
Price respected the mid-term resistance levels outlined in the previous August update. Mid-term support for the impulsive structure is 114–105. If these levels fail to hold, or if price cannot break above the Aug 24 highs, a more prolonged consolidation within the 108–95 macro support zone is likely.
Chart:
Price respected the mid-term resistance levels outlined in the previous August update and is now consolidating orderly within the mid-term support zone. Expecting a higher low to form within 3.10–2.75, continuing base formation before a potential larger-degree breakout.
Chart:
Is showing potential for a double bottom formation in the coming sessions. However, if price fails to break above 1–1.05 on any recovery attempt, the risk of a deeper correction toward macro support at 0.80–0.75 increases.
Chart:
Chart:
Price is consolidating within the mid-term support zone at 3.50–3.25. The macro structure remains bullish, but there is still a risk of further downside toward the 3–2.75 macro support if price fails to reclaim the 50DMA on any recovery attempt.
Chart:
Chart:
0.22–0.20 marks a key mid-term support zone where price could form a higher low before continuing upside momentum. Failure to reclaim August highs on any breakout attempt may lead to continued selling pressure toward macro support below early August lows.
Chart:
Chart:
Was unable to close above the local resistance zone highlighted in the previous August update and continues showing downside potential. Price may attempt to form a double bottom with early August lows, followed by a bounce toward the declining 50DMA. Macro support remains at 0.50–0.45. The weekly structure stays bullish for the long term, as long as price holds above April lows.
Daily chart:
Weekly chart:
Is trading within the macro support zone 1.30–0.95–0.80, following the larger-degree corrective structure first suggested in July. I am looking for price to start forming a higher low within this range.
Chart:
Chart:
$1000FLOKIUSDT key support zone to maintain macro bullish structure stands at 0.097–0.085–0.075. Holding above these levels keeps odds in favor of long-term upside continuation.
Chart:
Chart:
$1000000MOGUSDT.P corrective structure remains complex, but as long as price holds within the mid-term support zone at 0.89–0.77–0.70, the odds favor a potential upside reversal with a new base formation developing.
Chart:
Chart:
Chart:
📊 Daily FREE Market Insights | Crypto + US Stocks
⚡ Technical analysis, setups & commentary
🌍 t.me/MarketArtistryENG | 🇷🇺 t.me/marketartistry
⚡ Technical analysis, setups & commentary
🌍 t.me/MarketArtistryENG | 🇷🇺 t.me/marketartistry
Related publications
Disclaimer
The information and publications are not meant to be, and do not constitute, financial, investment, trading, or other types of advice or recommendations supplied or endorsed by TradingView. Read more in the Terms of Use.