Last week, Oil (WTI) experienced one of its biggest declines of the year as traders shifted their focus from the potential short term supply constraints that could be caused by further sanctions on Russia and buyers of Russian energy, to concerns of over supply as the International Energy Agency (IEA) warned of a record Oil surplus in 2026, US crude inventories rose and traders headed into a crucial OPEC+ decision on Sunday surrounding the size of their November production increases. This saw Oil drop from its Monday (Sept 29th) open at 65.27 to a Friday (Oct 3rd) close of 60.92, a fall of 6.7% and its lowest weekly close since late May.
Moving forward to the start of this week, Oil (WTI) prices have jumped around 2% from opening levels back to 62.00 (0800 BST) as traders breathe a small sigh of relief on news that the agreed OPEC+ production increase scheduled for November is only going to be 137k barrels per day and not a much bigger number.
However, while the OPEC+ decision does bring some very short term clarity and has led to some early repositioning from Oil traders, the issues regarding over supply could still remain and may possibly dictate the size of any further rally. This could impact trader decision making as they assess the next series of weekly updates on US inventories and try and work out if a deeper squeeze to the topside is possible or whether this latest rally could run out of steam.
Assessing the technical update could be helpful in this situation.
Technical Update: Downside Pressure Appears to Be Building
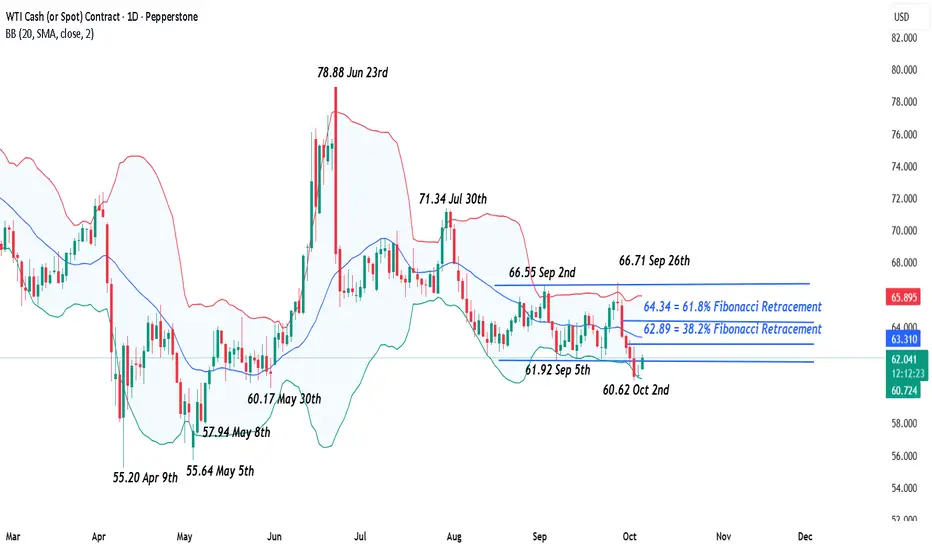
Throughout August and September, Oil (WTI) traded in a broadly sideways range, reflecting a tug-of-war between buyers and sellers with no clear directional bias. As the chart below shows, this consolidation unfolded between support at 61.92 (September 5th low) and resistance at 66.55/66.71 (September 2nd and 26th highs). This balanced structure underscored recent trader indecision, with a breakout of either side needed to suggest the possibility for an increase in volatility.

Interestingly, last Thursday’s extension of recent price declines saw closes below the support at 61.92 and traders may well be asking whether this might lead to a further phase of price declines.
While closing breaks from a rectangular range doesn’t guarantee further price weakness, risks do appear to be developing for continued downside pressure this week. With this in mind, it may prove useful to establish some potential support and resistance levels to gauge where the directional risks might now be materialising.
Potential Resistance Levels:
Since posting last week’s low at 60.62, Oil (WTI) has seen a modest price recovery. However, given the recent closing break below support at 61.92, traders may view this rebound as a limited reactive move.
Although further attempts to push to higher price levels are still possible, 62.89. which is the 38.2% retracement of the September 26th to October 2nd decline, may now be seen as the first resistance. While a break above 62.89 wouldn’t necessarily suggest an extended phase of price strength, it could open the way for tests of 64.34, the higher 61.8% retracement.
Potential Support Levels:
Having now seen the latest closing breaks below the lower extremes of the sideways range at 61.92, the risks could be for limited price recoveries and a possible extension of price weakness. As the chart below shows, this could lead to tests of lower support levels.
If this is to be the case, the 60.17 May 30th session low might prove to be the next support level, although if this does give way, the focus could then shift to the May 8th session low at 57.94.
The material provided here has not been prepared accordance with legal requirements designed to promote the independence of investment research and as such is considered to be a marketing communication. Whilst it is not subject to any prohibition on dealing ahead of the dissemination of investment research, we will not seek to take any advantage before providing it to our clients.
Pepperstone doesn’t represent that the material provided here is accurate, current or complete, and therefore shouldn’t be relied upon as such. The information, whether from a third party or not, isn’t to be considered as a recommendation; or an offer to buy or sell; or the solicitation of an offer to buy or sell any security, financial product or instrument; or to participate in any particular trading strategy. It does not take into account readers’ financial situation or investment objectives. We advise any readers of this content to seek their own advice. Without the approval of Pepperstone, reproduction or redistribution of this information isn’t permitted.
Moving forward to the start of this week, Oil (WTI) prices have jumped around 2% from opening levels back to 62.00 (0800 BST) as traders breathe a small sigh of relief on news that the agreed OPEC+ production increase scheduled for November is only going to be 137k barrels per day and not a much bigger number.
However, while the OPEC+ decision does bring some very short term clarity and has led to some early repositioning from Oil traders, the issues regarding over supply could still remain and may possibly dictate the size of any further rally. This could impact trader decision making as they assess the next series of weekly updates on US inventories and try and work out if a deeper squeeze to the topside is possible or whether this latest rally could run out of steam.
Assessing the technical update could be helpful in this situation.
Technical Update: Downside Pressure Appears to Be Building
Throughout August and September, Oil (WTI) traded in a broadly sideways range, reflecting a tug-of-war between buyers and sellers with no clear directional bias. As the chart below shows, this consolidation unfolded between support at 61.92 (September 5th low) and resistance at 66.55/66.71 (September 2nd and 26th highs). This balanced structure underscored recent trader indecision, with a breakout of either side needed to suggest the possibility for an increase in volatility.
Interestingly, last Thursday’s extension of recent price declines saw closes below the support at 61.92 and traders may well be asking whether this might lead to a further phase of price declines.
While closing breaks from a rectangular range doesn’t guarantee further price weakness, risks do appear to be developing for continued downside pressure this week. With this in mind, it may prove useful to establish some potential support and resistance levels to gauge where the directional risks might now be materialising.
Potential Resistance Levels:
Since posting last week’s low at 60.62, Oil (WTI) has seen a modest price recovery. However, given the recent closing break below support at 61.92, traders may view this rebound as a limited reactive move.
Although further attempts to push to higher price levels are still possible, 62.89. which is the 38.2% retracement of the September 26th to October 2nd decline, may now be seen as the first resistance. While a break above 62.89 wouldn’t necessarily suggest an extended phase of price strength, it could open the way for tests of 64.34, the higher 61.8% retracement.
Potential Support Levels:
Having now seen the latest closing breaks below the lower extremes of the sideways range at 61.92, the risks could be for limited price recoveries and a possible extension of price weakness. As the chart below shows, this could lead to tests of lower support levels.
If this is to be the case, the 60.17 May 30th session low might prove to be the next support level, although if this does give way, the focus could then shift to the May 8th session low at 57.94.
The material provided here has not been prepared accordance with legal requirements designed to promote the independence of investment research and as such is considered to be a marketing communication. Whilst it is not subject to any prohibition on dealing ahead of the dissemination of investment research, we will not seek to take any advantage before providing it to our clients.
Pepperstone doesn’t represent that the material provided here is accurate, current or complete, and therefore shouldn’t be relied upon as such. The information, whether from a third party or not, isn’t to be considered as a recommendation; or an offer to buy or sell; or the solicitation of an offer to buy or sell any security, financial product or instrument; or to participate in any particular trading strategy. It does not take into account readers’ financial situation or investment objectives. We advise any readers of this content to seek their own advice. Without the approval of Pepperstone, reproduction or redistribution of this information isn’t permitted.
Global risk Warning CFDs are complex instruments and come with a high risk of losing money rapidly due to leverage. Between 74-89% of retail investor accounts lose money when trading in CFDs. You should consider whether you understand how CFD
Disclaimer
The information and publications are not meant to be, and do not constitute, financial, investment, trading, or other types of advice or recommendations supplied or endorsed by TradingView. Read more in the Terms of Use.