1-Hour Technical Outlook
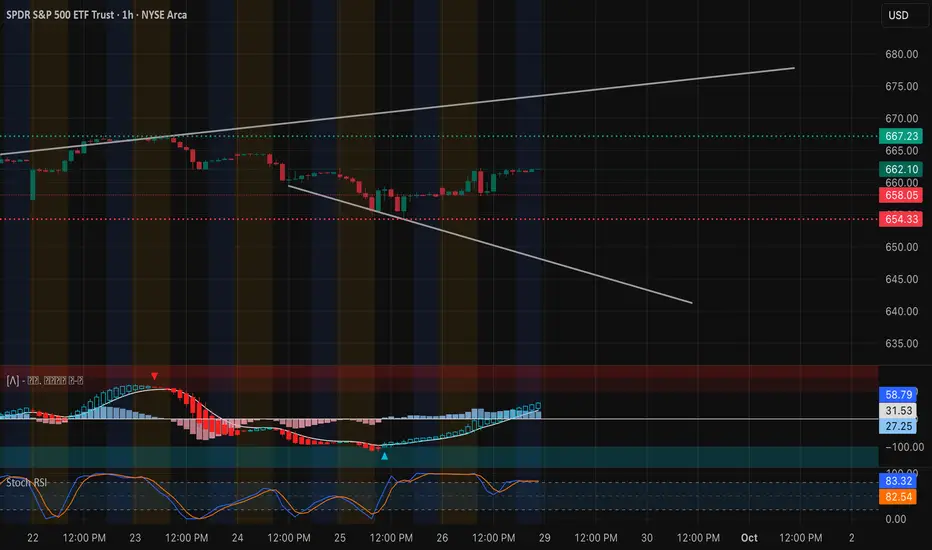
SPY has rebounded sharply off the $654–$655 demand zone, reclaiming $662 and now grinding toward the top of its rising wedge. The hourly MACD shows strong positive momentum and the Stoch RSI is elevated near overbought, suggesting bulls are in short-term control but may need a healthy pullback or consolidation to reset.
Key resistance lies at $664–$667, with a larger breakout level at $668. Support to monitor sits at $660, then $657, the key inflection area that triggered Friday’s bounce.
Gamma Exposure (GEX) Confirmation

The options market echoes the chart setup:
* Highest positive GEX / Call Resistance sits at $664–$667, with the strongest wall near $668, matching the upside breakout zone.
* Heavy Put Support rests at $657, with secondary layers around $655, forming a robust floor.
* Dealers are currently net short gamma, which can add fuel to intraday moves as price approaches these extremes.
A decisive hourly close above $667 could create a gamma squeeze toward $668+, while a drop under $657 would likely trigger defensive selling toward $655.
Trade Ideas & Option Plays for This Week
* Bullish Setup: Long on a clean break above $664–$667, targeting $668. Option setups: 0DTE or 2DTE 665/670 call spreads to manage risk and cost.
* Bearish Setup: Short if SPY fails at $664 and closes back below $657, targeting $655 or even $650. Consider 660/655 put spreads or short-dated puts.
* IVR around 14.5 and IVx ~13 mean option premiums are relatively low—good for debit strategies.
My Take SPY is attempting a trend resumption after last week’s pullback. The gamma map lines up perfectly with the technical picture: $657 is the line in the sand for bulls to defend, while $667–$668 is the breakout trigger. Expect increased volatility once price decisively moves beyond either side.
Disclaimer: This analysis is for educational purposes only and does not constitute financial advice. Always do your own research and manage risk before trading.
Gamma Exposure (GEX) Confirmation
The options market echoes the chart setup:
* Highest positive GEX / Call Resistance sits at $664–$667, with the strongest wall near $668, matching the upside breakout zone.
* Heavy Put Support rests at $657, with secondary layers around $655, forming a robust floor.
* Dealers are currently net short gamma, which can add fuel to intraday moves as price approaches these extremes.
A decisive hourly close above $667 could create a gamma squeeze toward $668+, while a drop under $657 would likely trigger defensive selling toward $655.
Trade Ideas & Option Plays for This Week
* Bullish Setup: Long on a clean break above $664–$667, targeting $668. Option setups: 0DTE or 2DTE 665/670 call spreads to manage risk and cost.
* Bearish Setup: Short if SPY fails at $664 and closes back below $657, targeting $655 or even $650. Consider 660/655 put spreads or short-dated puts.
* IVR around 14.5 and IVx ~13 mean option premiums are relatively low—good for debit strategies.
My Take SPY is attempting a trend resumption after last week’s pullback. The gamma map lines up perfectly with the technical picture: $657 is the line in the sand for bulls to defend, while $667–$668 is the breakout trigger. Expect increased volatility once price decisively moves beyond either side.
Disclaimer: This analysis is for educational purposes only and does not constitute financial advice. Always do your own research and manage risk before trading.
Disclaimer
The information and publications are not meant to be, and do not constitute, financial, investment, trading, or other types of advice or recommendations supplied or endorsed by TradingView. Read more in the Terms of Use.
Disclaimer
The information and publications are not meant to be, and do not constitute, financial, investment, trading, or other types of advice or recommendations supplied or endorsed by TradingView. Read more in the Terms of Use.