For this week, my bias is neutral/leaning bearish, however I will not fight the trend if my technical indicators give clear bullish signals. I believe the government will stay shut down for a while, as both parties are at an impasse and the administration will use the shutdown as an opportunity to advance its agenda against the federal workforce and non-aligned spending programs, rather than make concessions early on. Unless the opposition is willing to abandon its position with little to no gain, the possibility of this ending soon remains low in my view. Official economic data is currently on hold, so for the time being the stock market is operating with little fundamental basis and as a result, technicals could carry more weight.
1. Macro

Data from the Federal Reserve is currently delayed or on an indefinite hold, making the Real Yield of bonds ambiguous. Regardless, not much has changed since last week. The Dollar is starting out slightly above average but still flat - which should continue since there will be no policy changes or inflation data during the shutdown.
Yields have remained relatively flat but the 10Y yield is rising at a faster pace than the 3M yield, which can be seen on the bottom left chart that shows the spread. I’m not reading into the technicals too much here, however it will be important to see if this makes a higher high (spread widening, 10Y rising and/or 3M falling) or a lower low (spread tightening/inverting). Neither would be a particularly good sign but the former would likely be better received than the latter when it comes to stocks. As with the dollar, I think yields will remain relatively flat for the same reasons, which will prevent bond-market moves from being a driver.
My sentiment on commodities is roughly the same. Gold continues to rally, Oil may be in a downtrend, Copper ripped higher, and Corn stayed flat. Aside from Gold, I do not see anything on the charts of these commodities to provide a clear indication of a change in the growth or inflation outlook.
2. FX

Nothing new and worthy of note here. Yield spreads in the US and Britain (Black, Red) remain tight compared to elsewhere, but the higher yield may be a tailwind keeping the dollar steady. Over the past three months, the dollar has performed sightly better proportionately compared to other currencies, however it is still down significantly on the Year.
3. Risk

The top left chart is the option-adjusted spread of High Yield and Investment Grade corporate bonds indexed to 100. I’m not seeing an upside movement developing here yet (risk-off signal). On the middle chart, S&P Futures continue to significantly underperform Gold, fueled by the Gold rally and S&P making incremental gains. On the top right, I am starting to track the NNQ1!/YM1! spread to see how the mega caps are performing against companies in more traditional industries. Here it is clear that ever since the market bottomed in April, Nasdaq has been significantly outperforming the Dow Jones, however it appears this spread is set to tighten - either by Dow rising while Nasdaq stays flat/falls or Nasdaq falling proportionately more than Dow.
Notice how the Nasdaq/Dow curve started to flatten around the same time that Gold started to significantly outperform the S&P. I think this is an indicator that growth stocks will see pressure in the near future, and that we may currently be seeing rotation into safer sectors. This is evident in the outperformance of Industrials, Financials, Healthcare, and Utilities compared to growth sectors like Tech last week.
4. Options Chain
Gamma flip-flopped last week, making options data a misleading indicator unless you’re really in the know. With little fundamental backing, I expect dealers will assert more control than what is typical. Friday ended with most of the calls on volume getting taken out while paying some puts. Heading into this week, gamma on SPY should keep the price from rising above $672 or falling below $665 on Monday.
5. Bias
I’m going to split these screenshots up to make it easier to see what I’m looking at.

On my technical indicator chart, last week’s Weekly CVD (black) did not see a strong directional movement, although it remained below the zero line for most of the week, suggesting order flow favored the sell side despite the price reaching new ATHs.
Anchored OBV also suggests that last week was a battle between both sides.

Line break is great as a momentum indicator and has been flipping between both sides since October 1st. ES1! will need to make a new ATH and break above the resistance and close on the 1h timeframe to print a bullish bar, so right now I think the momentum is more to the downside.

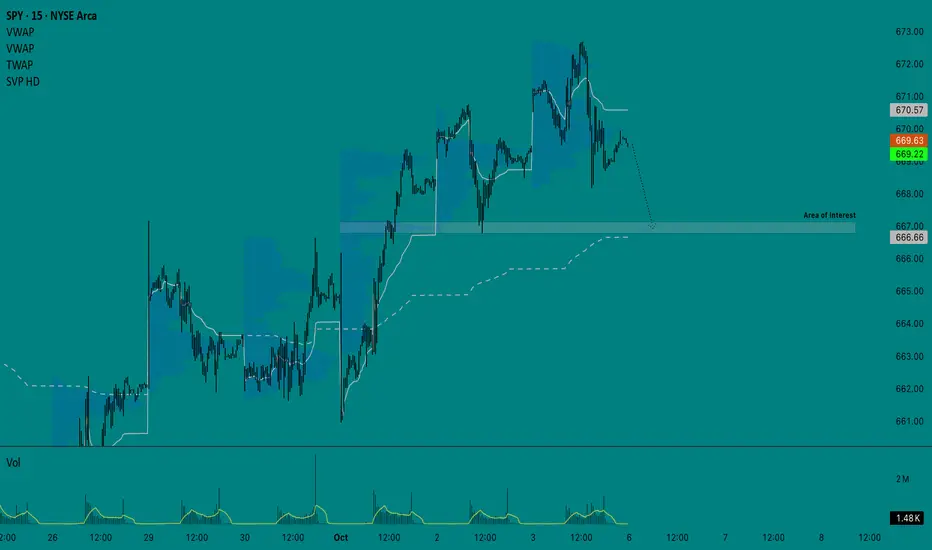
On Renko, which is my main chart, taking a purely technical read using the Wyckoff Method, I think this structure is bullish overall unless we see a swift move to the bottom of the range. Otherwise, it is fairly likely that we will at least see a pull back into the range. VWAP is set to Monthly to show we’re still above but could see a trend shift in the monthly frame of reference by breaking below it. How the price respects this range will be important to watch.

Lastly, when looking at the 4h chart on VIX, it appears to be coiling although it has remained mostly flat. VIX is outperforming its on volatility and the volatility of bonds, suggesting that any spikes are not part of larger risk-off positioning yet.
——————
My overall interpretation for this week is that although the Macro side remains roughly unchanged, I still retain my bias that the market is positioning for disappointing growth and clearly continues to show a preference for gold over stocks (heavy hedging). The absence of data reports due to the shutdown that could have validated these concerns (notably payrolls) have allowed dealers to assert more control over the price. For this reason, I will keep a close eye out for any changes and will adjust if the technicals on my Bias chart support a bullish position, but for now my near-term short target is to move back down to $666.
1. Macro
Data from the Federal Reserve is currently delayed or on an indefinite hold, making the Real Yield of bonds ambiguous. Regardless, not much has changed since last week. The Dollar is starting out slightly above average but still flat - which should continue since there will be no policy changes or inflation data during the shutdown.
Yields have remained relatively flat but the 10Y yield is rising at a faster pace than the 3M yield, which can be seen on the bottom left chart that shows the spread. I’m not reading into the technicals too much here, however it will be important to see if this makes a higher high (spread widening, 10Y rising and/or 3M falling) or a lower low (spread tightening/inverting). Neither would be a particularly good sign but the former would likely be better received than the latter when it comes to stocks. As with the dollar, I think yields will remain relatively flat for the same reasons, which will prevent bond-market moves from being a driver.
My sentiment on commodities is roughly the same. Gold continues to rally, Oil may be in a downtrend, Copper ripped higher, and Corn stayed flat. Aside from Gold, I do not see anything on the charts of these commodities to provide a clear indication of a change in the growth or inflation outlook.
2. FX
Nothing new and worthy of note here. Yield spreads in the US and Britain (Black, Red) remain tight compared to elsewhere, but the higher yield may be a tailwind keeping the dollar steady. Over the past three months, the dollar has performed sightly better proportionately compared to other currencies, however it is still down significantly on the Year.
3. Risk
The top left chart is the option-adjusted spread of High Yield and Investment Grade corporate bonds indexed to 100. I’m not seeing an upside movement developing here yet (risk-off signal). On the middle chart, S&P Futures continue to significantly underperform Gold, fueled by the Gold rally and S&P making incremental gains. On the top right, I am starting to track the NNQ1!/YM1! spread to see how the mega caps are performing against companies in more traditional industries. Here it is clear that ever since the market bottomed in April, Nasdaq has been significantly outperforming the Dow Jones, however it appears this spread is set to tighten - either by Dow rising while Nasdaq stays flat/falls or Nasdaq falling proportionately more than Dow.
Notice how the Nasdaq/Dow curve started to flatten around the same time that Gold started to significantly outperform the S&P. I think this is an indicator that growth stocks will see pressure in the near future, and that we may currently be seeing rotation into safer sectors. This is evident in the outperformance of Industrials, Financials, Healthcare, and Utilities compared to growth sectors like Tech last week.
4. Options Chain
Gamma flip-flopped last week, making options data a misleading indicator unless you’re really in the know. With little fundamental backing, I expect dealers will assert more control than what is typical. Friday ended with most of the calls on volume getting taken out while paying some puts. Heading into this week, gamma on
5. Bias
I’m going to split these screenshots up to make it easier to see what I’m looking at.
On my technical indicator chart, last week’s Weekly CVD (black) did not see a strong directional movement, although it remained below the zero line for most of the week, suggesting order flow favored the sell side despite the price reaching new ATHs.
Anchored OBV also suggests that last week was a battle between both sides.
Line break is great as a momentum indicator and has been flipping between both sides since October 1st.
On Renko, which is my main chart, taking a purely technical read using the Wyckoff Method, I think this structure is bullish overall unless we see a swift move to the bottom of the range. Otherwise, it is fairly likely that we will at least see a pull back into the range. VWAP is set to Monthly to show we’re still above but could see a trend shift in the monthly frame of reference by breaking below it. How the price respects this range will be important to watch.
Lastly, when looking at the 4h chart on VIX, it appears to be coiling although it has remained mostly flat. VIX is outperforming its on volatility and the volatility of bonds, suggesting that any spikes are not part of larger risk-off positioning yet.
——————
My overall interpretation for this week is that although the Macro side remains roughly unchanged, I still retain my bias that the market is positioning for disappointing growth and clearly continues to show a preference for gold over stocks (heavy hedging). The absence of data reports due to the shutdown that could have validated these concerns (notably payrolls) have allowed dealers to assert more control over the price. For this reason, I will keep a close eye out for any changes and will adjust if the technicals on my Bias chart support a bullish position, but for now my near-term short target is to move back down to $666.
Disclaimer
The information and publications are not meant to be, and do not constitute, financial, investment, trading, or other types of advice or recommendations supplied or endorsed by TradingView. Read more in the Terms of Use.
Disclaimer
The information and publications are not meant to be, and do not constitute, financial, investment, trading, or other types of advice or recommendations supplied or endorsed by TradingView. Read more in the Terms of Use.