1-Hour Time Frame
Technical Overview
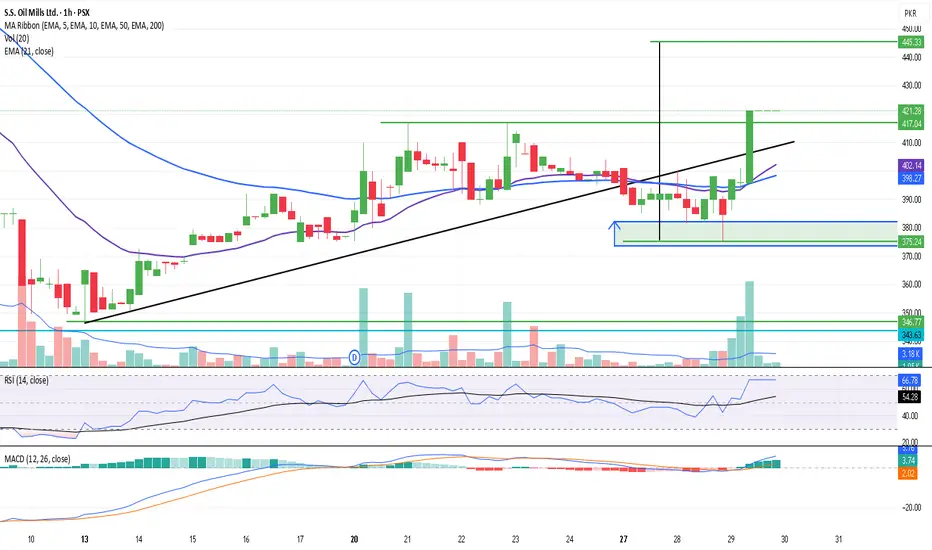
EMA 21 crossover EMA 50: Bullish crossover confirming short-term upside momentum.
Fibonacci Retracement: Price rebounded from the 0.618 golden zone, indicating a strong continuation setup.
MACD: Bullish crossover above the signal line — momentum shifting positive.
RSI: Trending upward around 66–70, still below overbought — supports further upside.
Volume: Noticeable increase on the breakout, confirming buying strength.
Swing Trade Plan
Buy Entry: Current market price ≈ PKR 376–378
Target Price (TP): PKR 445
Stop Loss (SL): PKR 372 (below recent swing-low and 0.618 retracement zone)
Risk-Reward Ratio: ~1 : 3 (good swing setup)
Trade Summary
Trend: Bullish short-term continuation
Pattern: EMA crossover + Fibonacci retracement rebound
Indicators: RSI and MACD both showing bullish signals
Confirmation: Volume breakout adds strength to the move
Technical Overview
EMA 21 crossover EMA 50: Bullish crossover confirming short-term upside momentum.
Fibonacci Retracement: Price rebounded from the 0.618 golden zone, indicating a strong continuation setup.
MACD: Bullish crossover above the signal line — momentum shifting positive.
RSI: Trending upward around 66–70, still below overbought — supports further upside.
Volume: Noticeable increase on the breakout, confirming buying strength.
Swing Trade Plan
Buy Entry: Current market price ≈ PKR 376–378
Target Price (TP): PKR 445
Stop Loss (SL): PKR 372 (below recent swing-low and 0.618 retracement zone)
Risk-Reward Ratio: ~1 : 3 (good swing setup)
Trade Summary
Trend: Bullish short-term continuation
Pattern: EMA crossover + Fibonacci retracement rebound
Indicators: RSI and MACD both showing bullish signals
Confirmation: Volume breakout adds strength to the move
Trade active
Trade closed: target reached
SSOM trade update: Target price (TP) hit successfully! Now using a trailing stop loss strategy — if price breaks down below EMA 9, I’ll close the trade.
Disclaimer
The information and publications are not meant to be, and do not constitute, financial, investment, trading, or other types of advice or recommendations supplied or endorsed by TradingView. Read more in the Terms of Use.
Disclaimer
The information and publications are not meant to be, and do not constitute, financial, investment, trading, or other types of advice or recommendations supplied or endorsed by TradingView. Read more in the Terms of Use.