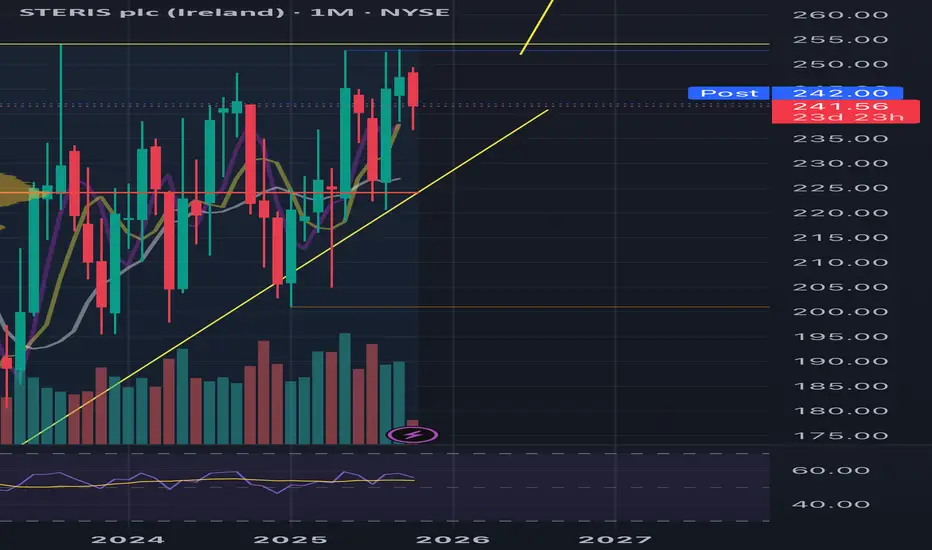
"STERIS plc (STE) monthly chart shows a classic bullish setup: after a strong long-term rally, the stock formed an ascending triangle pattern with rising lows and a strong resistance above. If  STE breaks out above resistance, the theoretical target—projecting the height of the pattern from the breakout zone—would be in the 335-350 range. Pattern confirmation and volume are key for trend continuation.
Disclaimer
The information and publications are not meant to be, and do not constitute, financial, investment, trading, or other types of advice or recommendations supplied or endorsed by TradingView. Read more in the Terms of Use.
Disclaimer
The information and publications are not meant to be, and do not constitute, financial, investment, trading, or other types of advice or recommendations supplied or endorsed by TradingView. Read more in the Terms of Use.