1️⃣ Trend & Demand Zones
HTF (Higher Time Frame) – Yearly, Half-Yearly, and Quarterly are all UP.
Strong support zones: 2,050 – 4,453 average demand.
MTF (Medium Time Frame) – Monthly, Weekly, Daily also UP.
Support zones around 5,626 – 7,374.
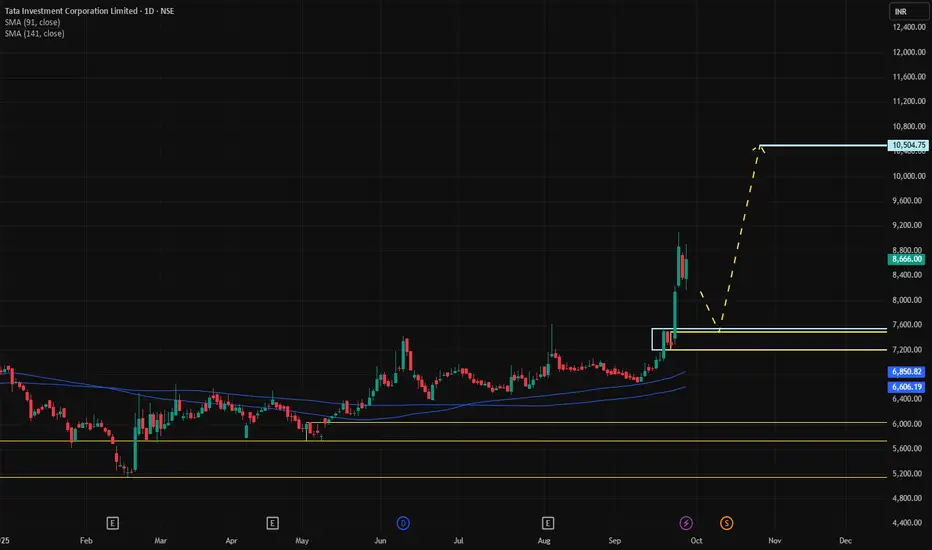
ITF (Intraday/Lower Time Frame) – All UP around 7,276–7,344.
📌 Overall: Uptrend across all time frames. Demand zones clustered between 7,200–7,400, making 7,202 a logical stop-loss.
2️⃣ Trade Plan Key Numbers
Parameter Value
Entry 7,545
Stop-loss (SL) 7,202
Target 10,419
Risk per share 343 (5%)
Reward per share 2,874 (38%)
Risk-Reward Ratio (RRR) ~8.38
Meaning: For every ₹1 risked, potential gain ~₹8.38.
3️⃣ Capital Allocation
Quantity planned: 500 shares
Total buy value: ₹3,772,500
Margin/MTF: 50% (₹1,886,250 actual capital used)
4️⃣ Brokerage & Taxes
Brokerage & other taxes (Buy + Sell): 0.49%
Brokerage Value: ₹18,492
5️⃣ Profit / Loss Scenarios
Scenario P/L (₹)
Profit if hits target +1,437,000 (Gross) → 1,418,508 (Net)
Loss if hits SL -171,500 (Gross) → 189,992 (Net)
Net RR (real): ~7.47.
6️⃣ Real ROI
MTF Capital: ₹1,886,250
Interest per annum: 9.69%
Total interest (4 months): ~₹60,091
Net Profit after interest: ~₹1,358,417
Real ROI in 4 months: ~72%
7️⃣ Key Takeaways
Strong uptrend on all time frames – aligns with a bullish plan.
Stop-loss at 7,202 is just below the critical demand zone, limiting downside risk.
Reward-to-risk ratio >7 is excellent.
ROI of 72% in 4 months shows attractive leverage with MTF but depends on the move to 10,419.
HTF (Higher Time Frame) – Yearly, Half-Yearly, and Quarterly are all UP.
Strong support zones: 2,050 – 4,453 average demand.
MTF (Medium Time Frame) – Monthly, Weekly, Daily also UP.
Support zones around 5,626 – 7,374.
ITF (Intraday/Lower Time Frame) – All UP around 7,276–7,344.
📌 Overall: Uptrend across all time frames. Demand zones clustered between 7,200–7,400, making 7,202 a logical stop-loss.
2️⃣ Trade Plan Key Numbers
Parameter Value
Entry 7,545
Stop-loss (SL) 7,202
Target 10,419
Risk per share 343 (5%)
Reward per share 2,874 (38%)
Risk-Reward Ratio (RRR) ~8.38
Meaning: For every ₹1 risked, potential gain ~₹8.38.
3️⃣ Capital Allocation
Quantity planned: 500 shares
Total buy value: ₹3,772,500
Margin/MTF: 50% (₹1,886,250 actual capital used)
4️⃣ Brokerage & Taxes
Brokerage & other taxes (Buy + Sell): 0.49%
Brokerage Value: ₹18,492
5️⃣ Profit / Loss Scenarios
Scenario P/L (₹)
Profit if hits target +1,437,000 (Gross) → 1,418,508 (Net)
Loss if hits SL -171,500 (Gross) → 189,992 (Net)
Net RR (real): ~7.47.
6️⃣ Real ROI
MTF Capital: ₹1,886,250
Interest per annum: 9.69%
Total interest (4 months): ~₹60,091
Net Profit after interest: ~₹1,358,417
Real ROI in 4 months: ~72%
7️⃣ Key Takeaways
Strong uptrend on all time frames – aligns with a bullish plan.
Stop-loss at 7,202 is just below the critical demand zone, limiting downside risk.
Reward-to-risk ratio >7 is excellent.
ROI of 72% in 4 months shows attractive leverage with MTF but depends on the move to 10,419.
Disclaimer
The information and publications are not meant to be, and do not constitute, financial, investment, trading, or other types of advice or recommendations supplied or endorsed by TradingView. Read more in the Terms of Use.
Disclaimer
The information and publications are not meant to be, and do not constitute, financial, investment, trading, or other types of advice or recommendations supplied or endorsed by TradingView. Read more in the Terms of Use.