🔍 Quick Summary
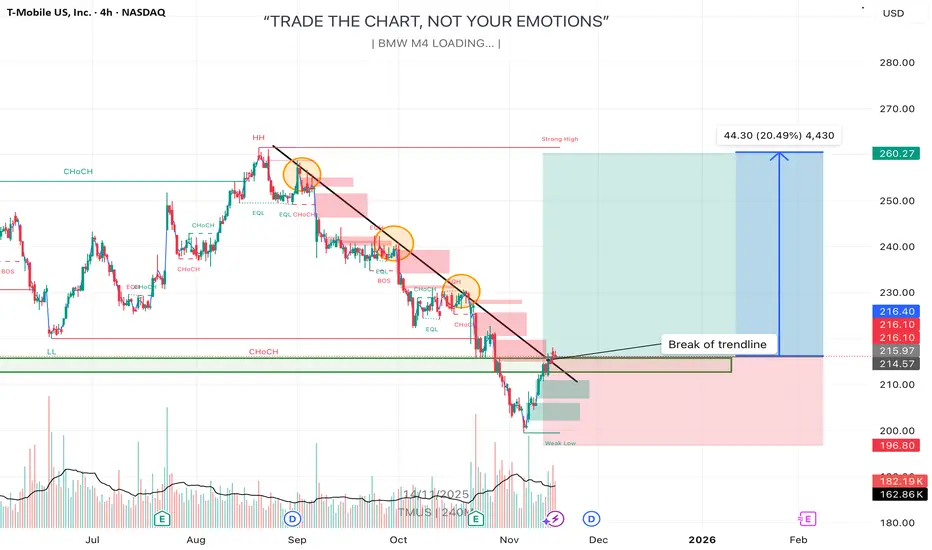
I’m seeing T‑Mobile US, Inc. (TMUS) break a long-term descending trendline and bounce off a key support region. The chart suggests a breakout scenario where I expect price to push toward the strong high near $260 (≈ +20% upside).
⸻
📊 Deep Analysis
• On the 4-hour timeframe, TMUS formed a clear down-sloping trendline that has held resistance on multiple touches (three orange circles). Each successive rejection appears weaker, indicating bearish momentum is fading.
• The price recently broke above the trendline and found support again in the green zone around $214-$216, which aligns with past structure (a strong demand region).
• The big projected move (~$44 to $260) corresponds to previous swing highs and structural liquidity. That aligns with typical “liquidity above weak high” mechanics.
• From a fundamental angle: T-Mobile has delivered strong results — in Q4 it beat earnings and subscriber growth expectations and raised guidance for 2025, which supports a bullish bias.  Also, it launched a new fibre service with a 5-year price lock and is expanding its satellite messaging offering, which strengthens future growth potential. 
• Since the chart shows a low risk (stop-loss) around the support zone and big reward potential toward the strong high, this setup meets favourable risk-reward criteria.
⸻
🎯 Trade Idea Scenario
Bullish Scenario
• Entry: Around ~$214–$216 support zone (preferably on confirmation of trendline retest or bullish price action)
• Target 1: ~$245–$250 (intermediate structure)
• Target 2: ~$260 (strong high liquidity zone)
• Stop-Loss / Invalidation: Below ~$202-$200 (if price breaks below support, setup invalidated)
Bearish Scenario
• If price fails to hold support and closes below ~$202-$200, risk opens toward ~$180 or lower support regions. In that case, bearish momentum resumes and the upside target no longer valid.
⸻
📌 What I’m Watching Next
• Candlestick reaction around the trendline retest: a strong bullish close would validate breakout.
• Volume: higher volume on breakout confirms strength; low volume may signal a fake.
• Support break below ~$202-$200 would cancel the bullish case and shift focus to downside.
• Fundamentals: any new update on fibre rollout, satellite service, or earnings could trigger acceleration.
⸻
⚠️ Disclaimer
This is my personal analysis and not financial advice. Please do your own research and manage your risk carefully. 📉📚
Related publications
Disclaimer
The information and publications are not meant to be, and do not constitute, financial, investment, trading, or other types of advice or recommendations supplied or endorsed by TradingView. Read more in the Terms of Use.
Related publications
Disclaimer
The information and publications are not meant to be, and do not constitute, financial, investment, trading, or other types of advice or recommendations supplied or endorsed by TradingView. Read more in the Terms of Use.