TOMOUSDT - Possible price actions
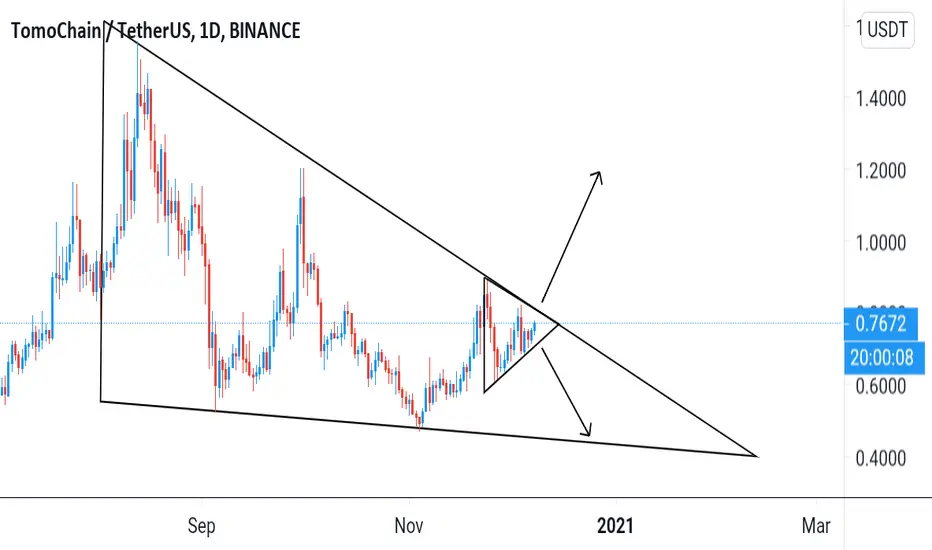
TOMOUSDT is testing the falling wedge resistance.
Price action is printing a symmetrical triangle pattern.
We could see a breakout above the symmetrical triangle + falling wedge resistance as bullish ⬆️ and a breadown below the symmetrical triangle support as bearish ⬇️.
.
Price action is printing a symmetrical triangle pattern.
We could see a breakout above the symmetrical triangle + falling wedge resistance as bullish ⬆️ and a breadown below the symmetrical triangle support as bearish ⬇️.
.
Related publications
Disclaimer
The information and publications are not meant to be, and do not constitute, financial, investment, trading, or other types of advice or recommendations supplied or endorsed by TradingView. Read more in the Terms of Use.
Related publications
Disclaimer
The information and publications are not meant to be, and do not constitute, financial, investment, trading, or other types of advice or recommendations supplied or endorsed by TradingView. Read more in the Terms of Use.