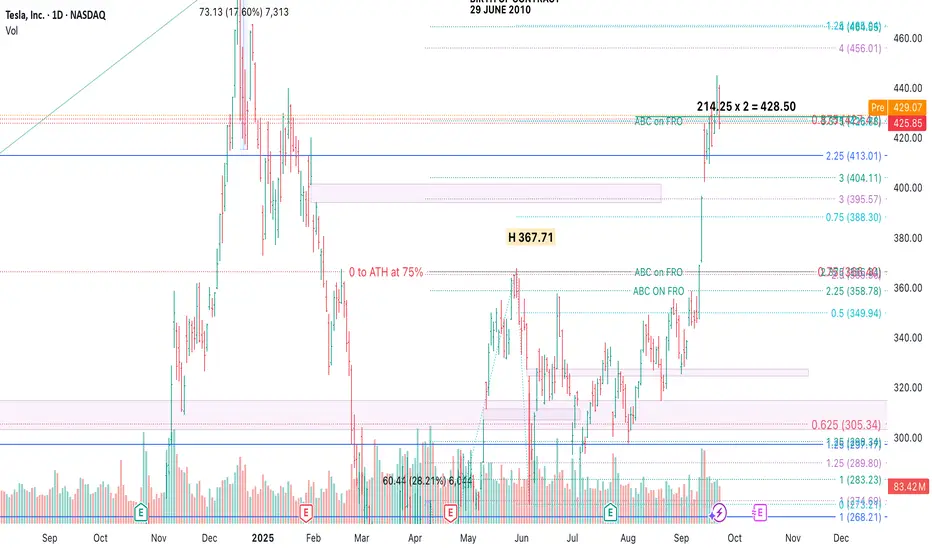
This chart highlights Tesla's price action through a potential ABC pattern, measured time cycles, and trend angles. The move from the April 2025 low to the recent September 2025 high spans 110 calendar days, mirroring a prior 110-day downswing — indicating possible time balance. Volume expansion supports the current uptrend, and we may be approaching a critical price/time resistance area. Watching for confirmation or reversal.
Disclaimer
The information and publications are not meant to be, and do not constitute, financial, investment, trading, or other types of advice or recommendations supplied or endorsed by TradingView. Read more in the Terms of Use.
Disclaimer
The information and publications are not meant to be, and do not constitute, financial, investment, trading, or other types of advice or recommendations supplied or endorsed by TradingView. Read more in the Terms of Use.