FET Ready For Re AccumulationAfter a common ABC retrace into the 50-61.8% area since its last low prices are approaching its trend line. FET has already seen major gains this cycle along with the merger of agix and ocean.
Current Trading Plan
Begin to re accumulate and watch crypto market as a whole for potentialy one more push to the upside this cycle.
Gann
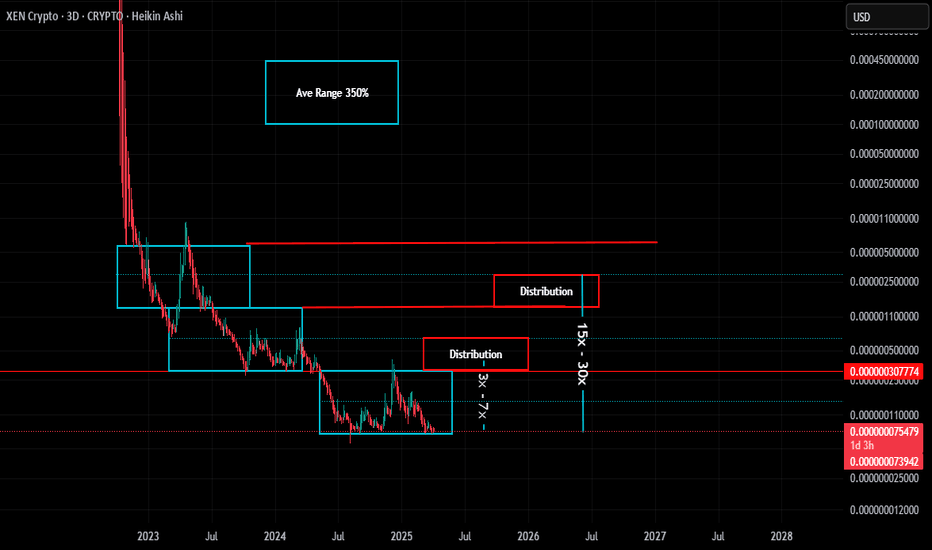
Xen Hopeful Double BottomXen is a project I have followed since launch and have always seen value in the team that created it. Mostly in th credentials of the creators, ability to produce numerous projects shows ability, interest, and drive to create.
Next on the list is the layer one block chain x1. Not sure on the timeline or if it will ever exisit but still highly interested in this project.
Current Trading Plan is to accumulate more xen at what is a hopefull double bottom. Looking at past price action it seems price has been allowed to run 150% quite a few times before exausting and 350% a few times as well. These reoccurring ranges will be used to take profit if there is a recovery.
HEX Dead?I see no real value in hex of any kind. With that said hex had Richard Heart. Regardless of opinions of Richard his efforts certainly built a massive following and interest in the project.
If at some point in this potential bottom territory if Richards lawsuits were to settle positively and restarts his live streaming and constant promotion efforts.... well he is good at it.
Current Trading Plan is nothing. If Richards law suits settle positively accumulate "some". If Richard returns to being Richard accumulate more.
#ZRO/USDT#ZRO
The price is moving in a descending channel on the 1-hour frame and is expected to continue upward.
We have a trend to stabilize above the 100 moving average once again.
We have a downtrend on the RSI indicator, supporting the upward move with a breakout.
We have a support area at the lower boundary of the channel at 2.95.
Entry price: 2.98
First target: 3.04
Second target: 3.10
Third target: 3.19
#GALA/USDT#GALA
The price is moving within a descending channel on the 1-hour frame, adhering well to it, and is on its way to breaking it strongly upwards and retesting it.
We are seeing a bounce from the lower boundary of the descending channel, this support at 0.01443.
We have a downtrend on the RSI indicator that is about to break and retest, supporting the upward trend.
We are looking for stability above the 100 Moving Average.
Entry price: 0.1460
First target: 0.01476
Second target: 0.01500
Third target: 0.01530
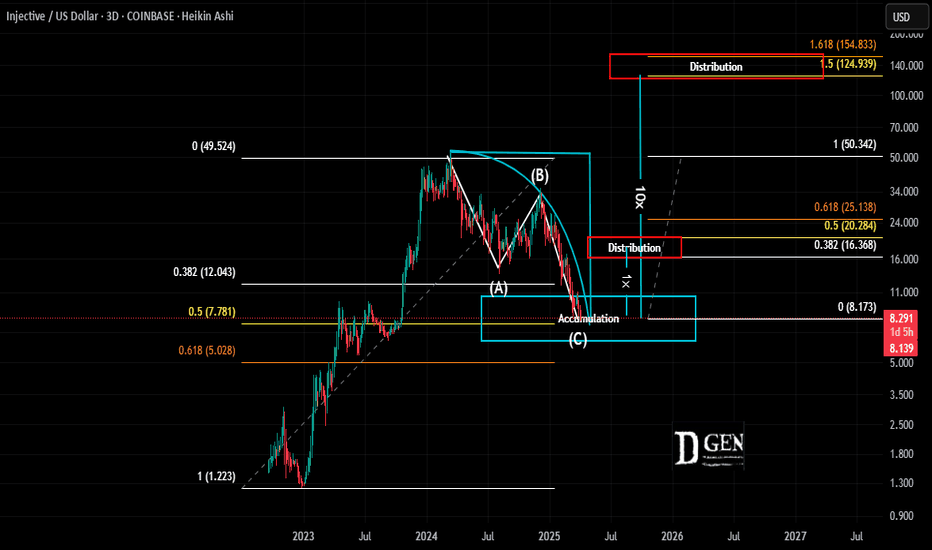
INJ Ready After 50% RetraceINJ is another crypto project that seen massive interest and price rise straight out of the bear market.
Now we see it has completed a very typical retrace pattern and percentage. Since reaching its all time high it has completed a standard ABC retrace of 50% of its low.
Current Trading Plan:
Re-accumulate and look for another major rise in price. Risk at this stage in the cycle is much higher as we are not at a bear market low. We are at a 50% retrace of that low.
Targets will be a 1/3-50% retrace back to the all time high and look for continuation for a much larger second run is the rest of the market show signs of recovery this summer.
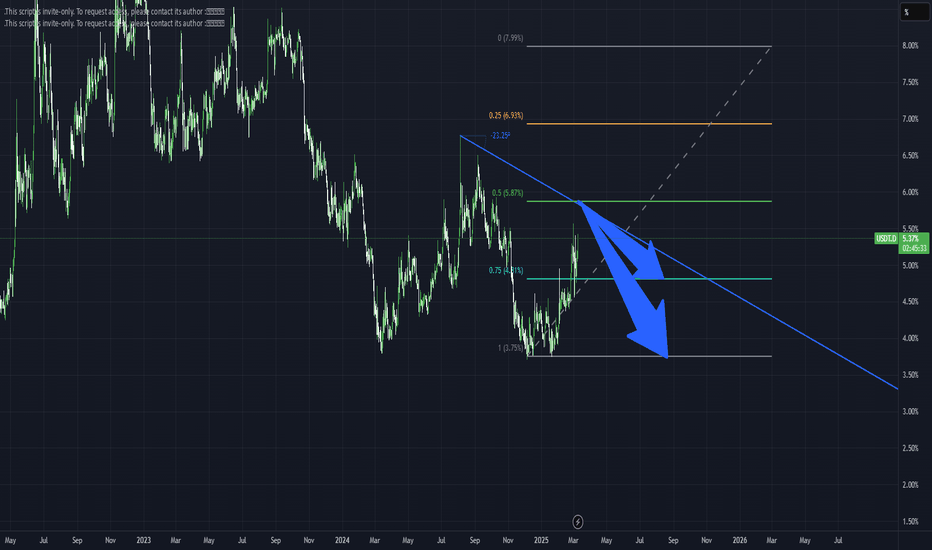
BTC dominance I thought BTC .D would have went down by now
Definitely was wrong
Last week.
I can’t make sense of it but dominance I on a steady path!
Just not slowing down at all
Hopefully for some change because
It hasn’t seen a real turn around since November-December that was all the pump it had.
Really that’s the only significant drop it has since it bottom a few years ago.
Alts need some kinda relief.
If that doesn’t come soon.
Much more pain will be here to stay.
A new growth opportunity for VIBVIB is preparing a new growth momentum today. As I wrote in previous reviews, finding a token below the 0.035 level is appropriate when the ether is below 1500, even if there is a monitoring tag. At the moment, the breakdown is more likely caused by panic sales on tag assignment. However, the assignment of the tag was obviously already worked out by the price when it fell below the 0.075 support. At the moment, I expect to enter the more appropriate 0.050-75 zone, corresponding to both the current market position and the tag. The opportunity for a refund will appear as soon as the indicators stop extinguishing sales, which has already happened on small timeframes. That is, today and tomorrow there is a high probability of a weekly candle reversal above the key support of 0.0350–375, and in the case of a daily or weekly candle opening higher, attempts to grow to 0.075-100 are likely, which is the main non-closed retest zone after the January impulse and is highly likely to be worked out. A retest of 0.035-50 from the current level will bring up to 100%+ profit.
BITCOIN - THE BEAR CONTINUES I have been tracking the bearish decline for Bitcoin for about 7 months. We look to be entering into the fireworks moment where it really dumps. The buying opportunity awaits. Unfortunately tho, its only for those who were wise enough to sell the top. My most conservative target has remained $73,500. However, $68,500 - $61,500 now look well within reach. So saving powder for those pull backs seems prudent. Will update upon breaks of $73,500. Elliot Wave, Murrey Math, Kumar Wave being used for this and all of my forecasts. Happy Trading, comments and DMs always welcomed.
#CGPT/USDT#CGPT
The price is moving within a descending channel on the 1-hour frame, adhering well to it, and is on its way to breaking it strongly upwards and retesting it.
We are seeing a bounce from the lower boundary of the descending channel, which is support at 0.0650.
We have a downtrend on the RSI indicator that is about to break and retest, supporting the upward trend.
We are looking for stability above the 100 Moving Average.
Entry price: 0.0654
First target: 0.0678
Second target: 0.0692
Third target: 0.0721
EFIH-LONGe-finance for Digital and Financial Investments S.A.E. (EGX:EFIH)
Technical Overview
• Current Price (April 3, 2025): 16.95 EGP/share
• 100-Week Range: 13.25 – 27 EGP/share
• Below EMA 200: Bearish sign; technically under long-term resistance
• Gann Analysis TP: ~32.11 EGP in Dec 2025 (based on( 2+((13.455))^1/2 )^2
• Elliott Wave Analysis: In Wave C (correction) is complete 16 EGP/share (current price near
upper bound) , ready to run up
Wyckoff selection is complete accommodation phase
• TP1: 19.1 EGP (Falling wage )
• TP2: 23.0 EGP (ROC)
• TP3:26.0 EGP (Daily R4)
• TP4: 32 EGP (Gann target) in Dec. 2025
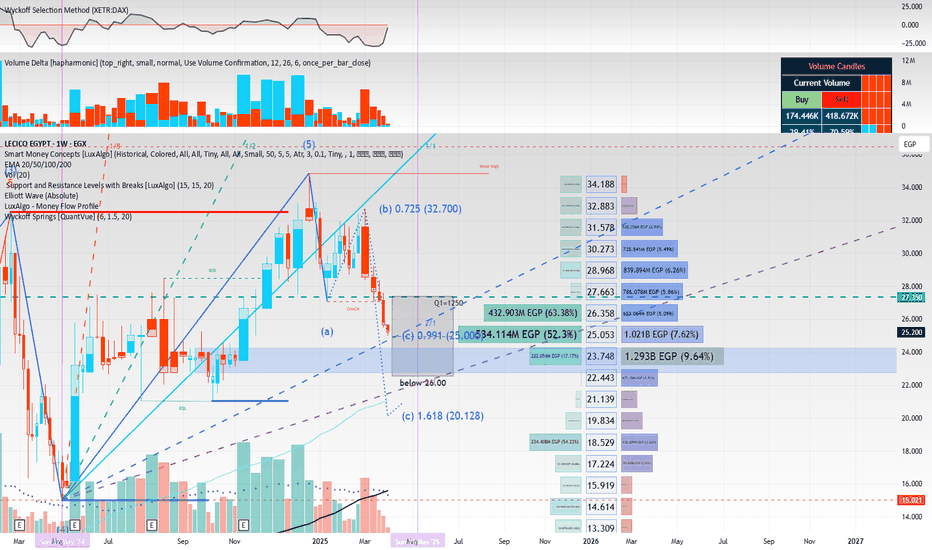
long-term investor (EGX:LCSW) (EGX:LCSW) Lecico Egypt (S.A.E.) produces and sells sanitary ware products and various tiles in Egypt and Lebanon. The company’s products include bathroom suites, toilets, washbasins, and bidets and urinals; and squatting pan, shower trays, kitchen sink, and taps, as well as other complementary products.The company exports its products. It sells its products under the Lecico brand.Lecico Egypt (S.A.E.) was incorporated in 1975 and is based in Alexandria, Egypt
Mid-Term Target Price (Fair Value Avg): ~85 EGP, implying ~237% potential upside from current levels.
• Technically Weak in Short-Term: Below EMA 200 and entering the Wave C correction suggests consolidation or dip toward the 21–25 EGP range before an upside move.
Technical Overview
• Current Price (April 3, 2025): 25.2 EGP/share
• 52-Week Range: 15.00 – 34.84 EGP/share
• Book Value per Share is 46.68 EGP
• Below EMA 200: Bearish sign; technically under long-term resistance
• Rate of Change (ROC): 24.6 EGP/share
• Gann Analysis TP: ~34.5 EGP in May 2025 (based on (15.02)2+2(15.02)^2 + 2(15.02)2+2)
• Elliott Wave Analysis: In Wave C (correction), target zone: 21–25 EGP/share (current price near upper bound)
Financial Highlights – FY 2024
• Revenue: EGP 6.64 billion (↑ 37% YoY)
• Net Profit: EGP 890.3 million (↑ 99% YoY)
• EPS: 11.13 EGP
• Sanitary Ware: 64.8% of revenue, 77.9% export-driven
• EBIT: EGP 1,151 million (↑ 22%)
• Margins:
o Gross: 28.22%
o Operating (EBIT): 17.32%
o Profit: 13.40%
o EBITDA: 19.47%
Interpretation & Conclusion
• Fundamentally Undervalued: With a P/E of 2.26× and P/B of 0.54×,
Lecico appears significantly undervalued given its strong profitability and book value.
Investment Strategy
If you’re a long-term investor:
• Accumulate in the 21–25 EGP correction zone.
• Monitor EMA 200 breakout and ROC reversal for momentum entry.
Mid-Term Upside Targets
• TP1: 34.5 EGP (Gann target)
• TP2: 58.8 EGP (DCF Value )
• TP3: 65.6 EGP (CHF estimate) refer to Cairo Financial Holding company
• TP4: 85.0–105.6 EGP (Sector-based fair value) refer to Ostoul Securities Brokerage Bond Trading Company
BTC ROADMAP IN 2025**BTC Analysis 2025 Roadmap**
As we embark on 2025, Bitcoin remains a pivotal player in the cryptocurrency landscape. This detailed analysis highlights crucial milestones, technical indicators, and market sentiment for traders to focus on throughout the year.
**1. Market Sentiment and Adoption:**
- The projected increase in institutional investment and broader mainstream adoption is likely to significantly impact Bitcoin's trajectory. Stay alert to developments in regulations and corporate endorsements of cryptocurrency.
**2. Technical Indicators:**
- Scrutinize moving averages (50-day and 200-day) for potential signals to buy or sell. A bullish crossover could suggest a robust uptrend is underway.
- Utilize Relative Strength Index (RSI) and Moving Average Convergence Divergence (MACD) to assess market conditions for overbought or oversold scenarios.
**3. Key Support and Resistance Levels:**
- Pinpoint critical support levels around $30,000 and $25,000, which may present buying opportunities if Bitcoin experiences price corrections.
- Watch for resistance levels at $40,000 and $50,000; a breakout beyond these levels could signify the commencement of a new bullish phase.
**4. Halving Event Impact:**
- With the next Bitcoin halving anticipated in 2024, historically, this event has precipitated price increases. Pay close attention to market movements following the halving for potential bullish trends.
**5. Market Correlation:**
- Observe the correlation between Bitcoin and traditional financial markets, particularly during times of economic volatility. A strong relationship with gold may indicate shifts in investor behavior.
**6. Macro-Economic Factors:**
- Remain vigilant regarding inflation rates, interest rate changes, and overall economic conditions, as these elements profoundly influence Bitcoin's price dynamics.
**Conclusion:**
In 2025, the path of Bitcoin will be shaped by a confluence of technological advancements, regulatory changes, and evolving market dynamics. Active traders should leverage technical analysis and stay updated on global economic influences to make strategic decisions. Remember, effective risk management is essential in navigating the inherent volatility of this market.
#DYM/USDT#DYM
The price is moving within a descending channel on the 1-hour frame and is expected to continue upward.
We have a trend to stabilize above the 100 moving average once again.
We have a downtrend on the RSI indicator, supporting the upward move with a breakout.
We have a support area at the lower boundary of the channel at 0.250.
Entry price: 0.255
First target: 0.257
Second target: 0.262
Third target: 0.0267
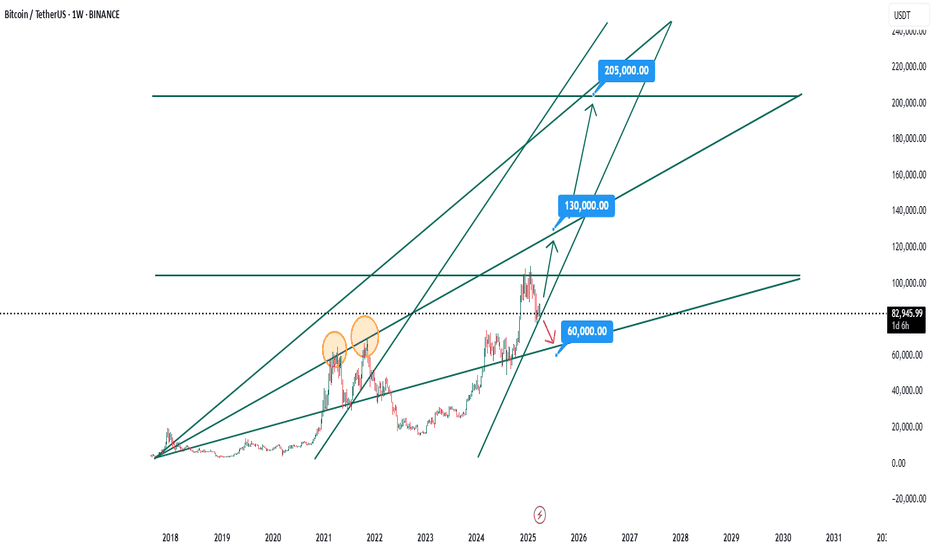
BTC up Or DownBitcoin has not yet completed its ascending channel, with the possibility that inflation and unemployment will increase under Trump's economic policy. Bitcoin price may reach 130k and 200k, but if Trump's economic surgery really works, it will fall to 60k. I am not optimistic about Trump's economic policy. The chart below is drawn with a Gann box.
CFX Ready For Another Leg To The Upside?It has been a while since taking much interest in our favorite crypto projects. After massive gains straight out of the bear market most of that interest has sold off.
Previously we were targeting the 5 cent range and appear to be getting very close.
Current Trading Plan:
Looking at proportional relationships in the price chart to gauge potential moves we can see the average range size seems to be about 400%. After completing a traditional ABC pattern it has moved into our potential accumulation window. Currently looking to accumulate and hold for potential 10x IF the entire market follows.
Nifty Futures intraday trend analysis on April 7th & 8thAccording to my Trend Analysis, on 7th Nifty Futures is likely to bounce back and the raise will not sustain on April 8th. The levels provided in the chart are calculated without taking Gaps into account. In the first 15mts on 7th April, there is a bullish candle formation. Trade with Stop-Loss.

