TSLA is in an interesting spot right now. It had a sharp move up, then immediately ran into resistance and started compressing. That kind of price action usually tells me the market is deciding whether this was a real breakout attempt or just a squeeze before another leg down.
Price pushed up fast, then stalled, and now it’s moving sideways under resistance. That’s not aggressive buying — it’s hesitation. Buyers showed up once, but they haven’t followed through yet.
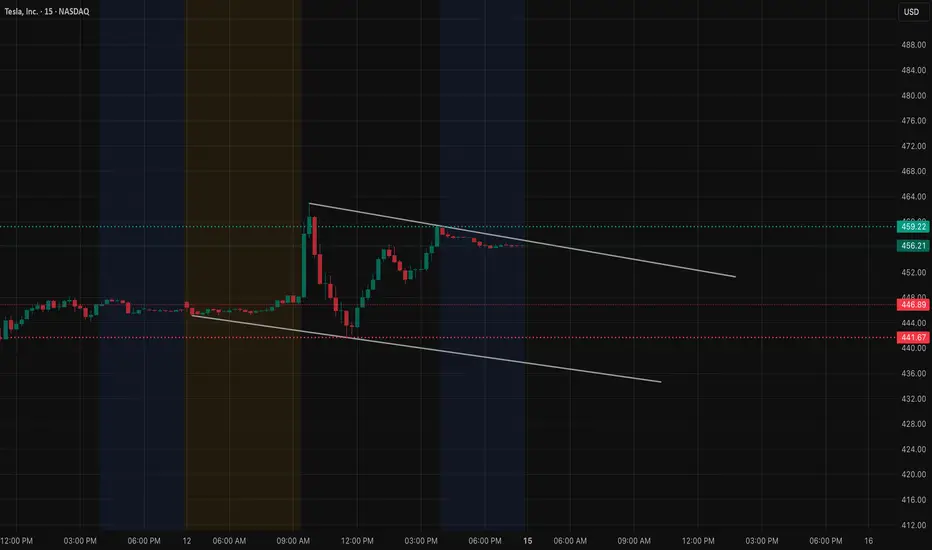
Right now, TSLA is sitting just under a key resistance zone, and how it behaves there matters a lot.
Levels that matter on this chart
The main level I’m watching is 455–460.
This zone has been acting like a ceiling. Price pushed into it and immediately slowed down. If TSLA can’t reclaim and hold above this area, then the move up starts to look more like a reaction than a trend change.
Above that, 465–470 is the next area where sellers are likely waiting. If price gets there without strong momentum, I’d expect selling pressure again.
On the downside, 445–447 is the first real support. If TSLA loses that area, the chart opens up toward 440, and below that, 435 becomes the next downside magnet.
How the GEX options positioning lines up

Options positioning explains why price is stalling here.
There’s strong CALL interest overhead, which often acts like resistance unless price can push through with volume. At the same time, PUT support sits lower, which helps explain why pullbacks haven’t fully unraveled yet.
This creates a squeeze-like environment: upside is capped for now, downside is supported — until one side gives way.
That’s usually where volatility comes from.
If it keeps getting rejected under 455–460, I’m cautious chasing longs. That’s where I’d expect sellers to lean again.
A clean hold above 460 changes the conversation and opens the door toward 470+.
On the flip side, a loss of 445 would tell me the bounce failed, and downside continuation becomes the higher-probability path.
So for me:
* Below 445 → downside pressure builds
* Between 445–460 → chop, fakeouts likely
* Above 460 with acceptance → bullish continuation attempt
Until price proves otherwise, this still feels like compression under resistance, not a confirmed breakout.
This analysis is for educational purposes only and does not constitute financial advice.
Price pushed up fast, then stalled, and now it’s moving sideways under resistance. That’s not aggressive buying — it’s hesitation. Buyers showed up once, but they haven’t followed through yet.
Right now, TSLA is sitting just under a key resistance zone, and how it behaves there matters a lot.
Levels that matter on this chart
The main level I’m watching is 455–460.
This zone has been acting like a ceiling. Price pushed into it and immediately slowed down. If TSLA can’t reclaim and hold above this area, then the move up starts to look more like a reaction than a trend change.
Above that, 465–470 is the next area where sellers are likely waiting. If price gets there without strong momentum, I’d expect selling pressure again.
On the downside, 445–447 is the first real support. If TSLA loses that area, the chart opens up toward 440, and below that, 435 becomes the next downside magnet.
How the GEX options positioning lines up
Options positioning explains why price is stalling here.
There’s strong CALL interest overhead, which often acts like resistance unless price can push through with volume. At the same time, PUT support sits lower, which helps explain why pullbacks haven’t fully unraveled yet.
This creates a squeeze-like environment: upside is capped for now, downside is supported — until one side gives way.
That’s usually where volatility comes from.
If it keeps getting rejected under 455–460, I’m cautious chasing longs. That’s where I’d expect sellers to lean again.
A clean hold above 460 changes the conversation and opens the door toward 470+.
On the flip side, a loss of 445 would tell me the bounce failed, and downside continuation becomes the higher-probability path.
So for me:
* Below 445 → downside pressure builds
* Between 445–460 → chop, fakeouts likely
* Above 460 with acceptance → bullish continuation attempt
Until price proves otherwise, this still feels like compression under resistance, not a confirmed breakout.
This analysis is for educational purposes only and does not constitute financial advice.
Disclaimer
The information and publications are not meant to be, and do not constitute, financial, investment, trading, or other types of advice or recommendations supplied or endorsed by TradingView. Read more in the Terms of Use.
Disclaimer
The information and publications are not meant to be, and do not constitute, financial, investment, trading, or other types of advice or recommendations supplied or endorsed by TradingView. Read more in the Terms of Use.