Hello, fellow traders,
This is a technical analysis of Tesla (TSLA) on the 15-minute chart. The purpose of this post is to outline a potential trading setup based on price action and key technical levels.[1]
Analysis:
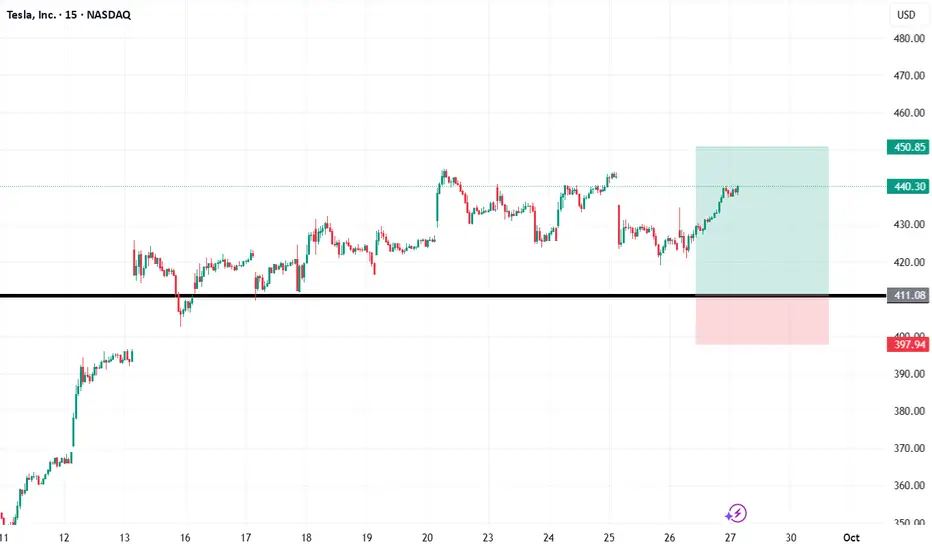
We can observe a clear horizontal support level forming around the $411.00 area. This level has been a significant pivot point in the recent past, with the price showing a strong reaction after testing it. The presence of such a support level suggests a potential area where buying interest may step in, providing a foundation for a possible move higher.
The chart displays a hypothetical long trade setup originating from this support zone, illustrating a practical application of this analysis.
Potential Trade Plan:
Entry: An entry is considered around $411.08, anticipating a bounce from the retest of the established support.
Stop Loss: A stop loss is placed at approximately $397.94. This level is positioned below the support zone and a recent swing low to manage risk should the support level fail to hold.
Take Profit: The profit target is set near $450.85. This level could act as resistance and represents a logical area to take profits.
This setup provides a favorable risk-to-reward ratio of approximately 3:1, which is a key component of a sound risk management strategy.
Disclaimer: This is not financial advice. The information and analysis provided are for educational and informational purposes only. Trading involves significant risk, and you should always conduct your own research and analysis before making any investment decisions. Trade responsibly.
This is a technical analysis of Tesla (TSLA) on the 15-minute chart. The purpose of this post is to outline a potential trading setup based on price action and key technical levels.[1]
Analysis:
We can observe a clear horizontal support level forming around the $411.00 area. This level has been a significant pivot point in the recent past, with the price showing a strong reaction after testing it. The presence of such a support level suggests a potential area where buying interest may step in, providing a foundation for a possible move higher.
The chart displays a hypothetical long trade setup originating from this support zone, illustrating a practical application of this analysis.
Potential Trade Plan:
Entry: An entry is considered around $411.08, anticipating a bounce from the retest of the established support.
Stop Loss: A stop loss is placed at approximately $397.94. This level is positioned below the support zone and a recent swing low to manage risk should the support level fail to hold.
Take Profit: The profit target is set near $450.85. This level could act as resistance and represents a logical area to take profits.
This setup provides a favorable risk-to-reward ratio of approximately 3:1, which is a key component of a sound risk management strategy.
Disclaimer: This is not financial advice. The information and analysis provided are for educational and informational purposes only. Trading involves significant risk, and you should always conduct your own research and analysis before making any investment decisions. Trade responsibly.
Disclaimer
The information and publications are not meant to be, and do not constitute, financial, investment, trading, or other types of advice or recommendations supplied or endorsed by TradingView. Read more in the Terms of Use.
Disclaimer
The information and publications are not meant to be, and do not constitute, financial, investment, trading, or other types of advice or recommendations supplied or endorsed by TradingView. Read more in the Terms of Use.