🏛️ RESEARCH NOTES
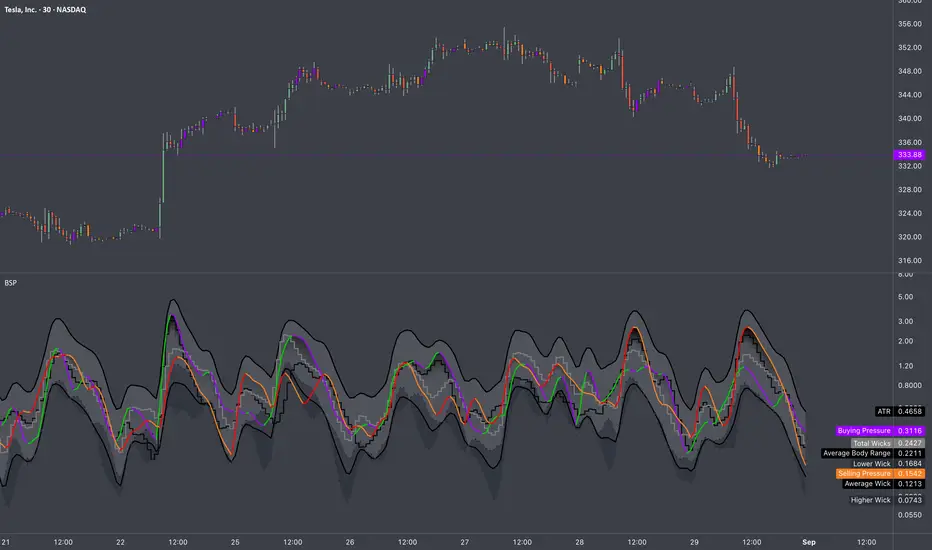
Buying & Selling Pressure measures the internal dynamics within a candlestick that shapes the trends. It dissects each OHLC range into distinct components made of Body Range, Higher & Lower Wicks, making it possible to quantify bullish & bearish parts of bar range. BSP doesn’t just point direction, it reveals magnitude - how much buyers or sellers injected into the move, and whether that push is accelerating or running out of steam.
Unlike Average %Δ, which uses separate conditional averaging by "count", BSP processes candles through periodic averaging that makes it more responsive for important transitions like: divergence from volatility benchmarks. incentive change (spotting early reversals after impulsive move), filtering false breakouts, confirming trend strength, etc.

⚖️ Candle Metrics
◇ Practical Interpretation
Buying & Selling Pressure measures the internal dynamics within a candlestick that shapes the trends. It dissects each OHLC range into distinct components made of Body Range, Higher & Lower Wicks, making it possible to quantify bullish & bearish parts of bar range. BSP doesn’t just point direction, it reveals magnitude - how much buyers or sellers injected into the move, and whether that push is accelerating or running out of steam.
Unlike Average %Δ, which uses separate conditional averaging by "count", BSP processes candles through periodic averaging that makes it more responsive for important transitions like: divergence from volatility benchmarks. incentive change (spotting early reversals after impulsive move), filtering false breakouts, confirming trend strength, etc.
⚖️ Candle Metrics
- Buying Pressure (BP)
Represents the degree of upward displacement relative to prior reference points.
🟢 Rising BP: Signals growing demand absorption and accumulation, often preceding sustained advances.
🟣 Falling BP: Indicates waning participation from buyers; persistent declines while price rises suggest trend fatigue and elevated risk of retracement. - Selling Pressure (SP)
Captures downward displacement relative to highs and prior closes.
🔴 Rising SP: Reflects heightened distribution activity, consistent with institutional supply or hedging flows.
🟡 Falling SP: Suggests sellers are withdrawing liquidity; commonly observed near troughs as downside momentum exhausts. - Average True Range (ATR) Rising ATR = higher volatility, falling ATR = calm markets. High BP in low ATR = stealth accumulation.
- Body Range (BR) Large bodies show conviction, small bodies = indecision. Strong BR + rising BP = solid bullish trend.
- Higher Wick (HW) Long HW means rejection at highs (supply). Falling HW means buyers are holding gains.
- Lower Wick (LW) Long LW means rejection at lows (demand). Falling LW signals less defense from buyers.
- Total Wicks (TW) More wick length = intrabar battles. Expansion of TW with small bodies often precedes reversals.
- Average Wick (AW)
Rising AW = more volatility both ways. Falling AW = cleaner, directional trend. - Darkened Tops
Tracks the strongest side (BP or SP) over the lookback period. Its primary function is to dynamically highlight moments of extreme pressure. When either the Buying or Selling Pressure value reaches the level, the tops would . This provides an immediate visual cue for:
Black Colored Plot: A signal that the current buying or selling pressure has hit a significant level relative to recent history, often pointing to climactic activity or a potential exhaustion point.
◇ Practical Interpretation
- Trend Confirmation BP ↑, SP ↓, BR ↑, ATR steady → sustainable directional advance.
- Exhaustion BP ↓, SP steady or rising, HW ↑ = buyers tiring at resistance, overextended into supply.
- Accumulation BP ↑, LW ↑, TW ↑ but ATR low = stealth buying before breakout.
- Distribution SP ↑, HW ↑, TW ↑ = sellers unloading into strength. supply emerging into strength, caution warranted.
Unlock exclusive tools: fractlab.com
ᴀʟʟ ᴄᴏɴᴛᴇɴᴛ ᴘʀᴏᴠɪᴅᴇᴅ ʙʏ ꜰʀᴀᴄᴛʟᴀʙ ɪꜱ ɪɴᴛᴇɴᴅᴇᴅ ꜰᴏʀ ɪɴꜰᴏʀᴍᴀᴛɪᴏɴᴀʟ ᴀɴᴅ ᴇᴅᴜᴄᴀᴛɪᴏɴᴀʟ ᴘᴜʀᴘᴏꜱᴇꜱ ᴏɴʟʏ.
ᴘᴀꜱᴛ ᴘᴇʀꜰᴏʀᴍᴀɴᴄᴇ ɪꜱ ɴᴏᴛ ɪɴᴅɪᴄᴀᴛɪᴠᴇ ᴏꜰ ꜰᴜᴛᴜʀᴇ ʀᴇꜱᴜʟᴛꜱ.
ᴀʟʟ ᴄᴏɴᴛᴇɴᴛ ᴘʀᴏᴠɪᴅᴇᴅ ʙʏ ꜰʀᴀᴄᴛʟᴀʙ ɪꜱ ɪɴᴛᴇɴᴅᴇᴅ ꜰᴏʀ ɪɴꜰᴏʀᴍᴀᴛɪᴏɴᴀʟ ᴀɴᴅ ᴇᴅᴜᴄᴀᴛɪᴏɴᴀʟ ᴘᴜʀᴘᴏꜱᴇꜱ ᴏɴʟʏ.
ᴘᴀꜱᴛ ᴘᴇʀꜰᴏʀᴍᴀɴᴄᴇ ɪꜱ ɴᴏᴛ ɪɴᴅɪᴄᴀᴛɪᴠᴇ ᴏꜰ ꜰᴜᴛᴜʀᴇ ʀᴇꜱᴜʟᴛꜱ.
Disclaimer
The information and publications are not meant to be, and do not constitute, financial, investment, trading, or other types of advice or recommendations supplied or endorsed by TradingView. Read more in the Terms of Use.