It's unclear if the wave structure is complete, but right now it looks like we have an ABC flat on both charts.
Interestingly, TSLA looks like it's in a Wave 4 (meaning up afterwards) while NIO is below its initial IPO price. So the question is, do both stocks trend together? So far the similar wave pattern would suggest it.
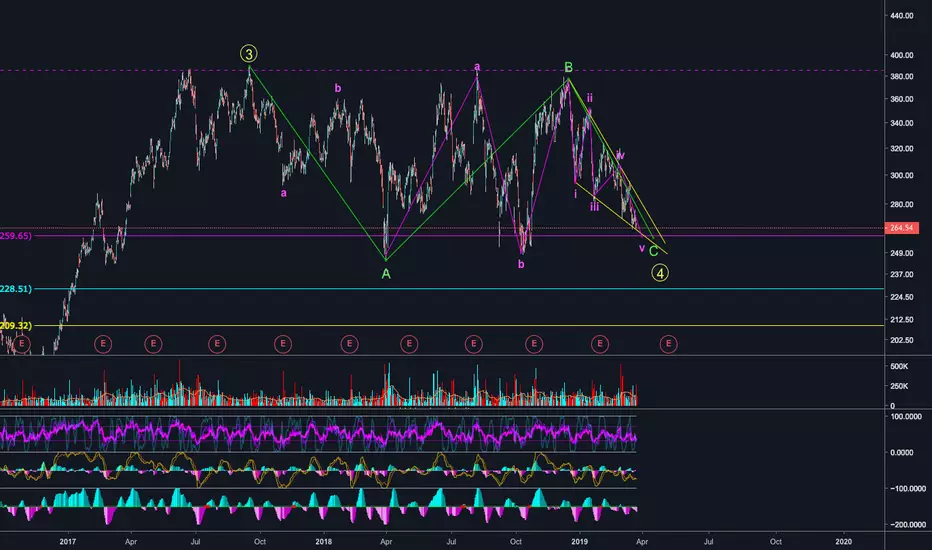
Interestingly, TSLA looks like it's in a Wave 4 (meaning up afterwards) while NIO is below its initial IPO price. So the question is, do both stocks trend together? So far the similar wave pattern would suggest it.
Note
NIO chart:Disclaimer
The information and publications are not meant to be, and do not constitute, financial, investment, trading, or other types of advice or recommendations supplied or endorsed by TradingView. Read more in the Terms of Use.
Disclaimer
The information and publications are not meant to be, and do not constitute, financial, investment, trading, or other types of advice or recommendations supplied or endorsed by TradingView. Read more in the Terms of Use.