The Nasdaq-100 is currently trading at fresh all-time highs, which naturally makes it more difficult to identify strong, well-tested support and resistance levels. With limited historical price action to lean on, these zones should be viewed as guidelines rather than exact buy or sell levels. Traders should remain cautious and flexible in their execution.
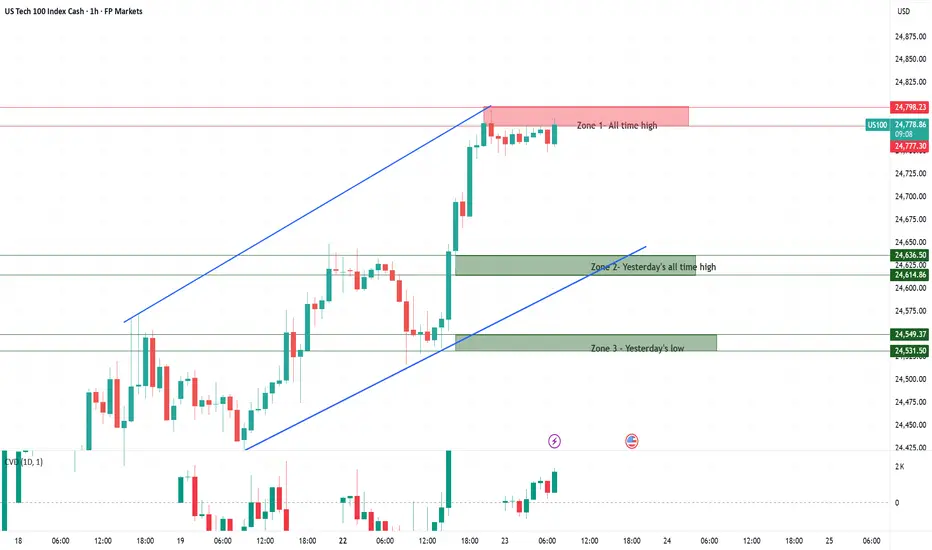
Zone 1 – All-time high & yesterday’s high:
This area represents the current record high and the most immediate point of resistance. Price action here is uncharted territory, so reactions can be volatile. A breakout above this zone would confirm continued strength, while rejection could trigger short-term pullbacks.
Zone 2 – Yesterday’s all-time high:
This former high now acts as a potential reference support. If tested, it may attract buyers looking to defend the trend, but given the lack of historical confirmation, reliability remains limited.
Zone 3 – Yesterday’s low:
This marks the lower boundary of recent price action and serves as the next potential support area. If broken decisively, it could indicate fading momentum and open the door for a deeper retracement.
Nas100 is trading near record highs with strong momentum driven by the tech sector, especially AI leaders like Nvidia. The overall sentiment remains bullish, but traders should watch for potential consolidation as the index approaches resistance and technical indicators signal overbought conditions. Regulatory headlines and Fed rate-cut expectations could act as key catalysts for volatility.
Disclaimer
The information and publications are not meant to be, and do not constitute, financial, investment, trading, or other types of advice or recommendations supplied or endorsed by TradingView. Read more in the Terms of Use.
Disclaimer
The information and publications are not meant to be, and do not constitute, financial, investment, trading, or other types of advice or recommendations supplied or endorsed by TradingView. Read more in the Terms of Use.